Share on
SUMMARY
1. The international economic scenario was characterised by great uncertainty even before the outbreak of war in Iran on 28 February 2026, which then spread to neighbouring countries. Uncertainty was mainly due to the US tariffs introduced in 2025. This was leading to major corrections in trade flows between the various economies.
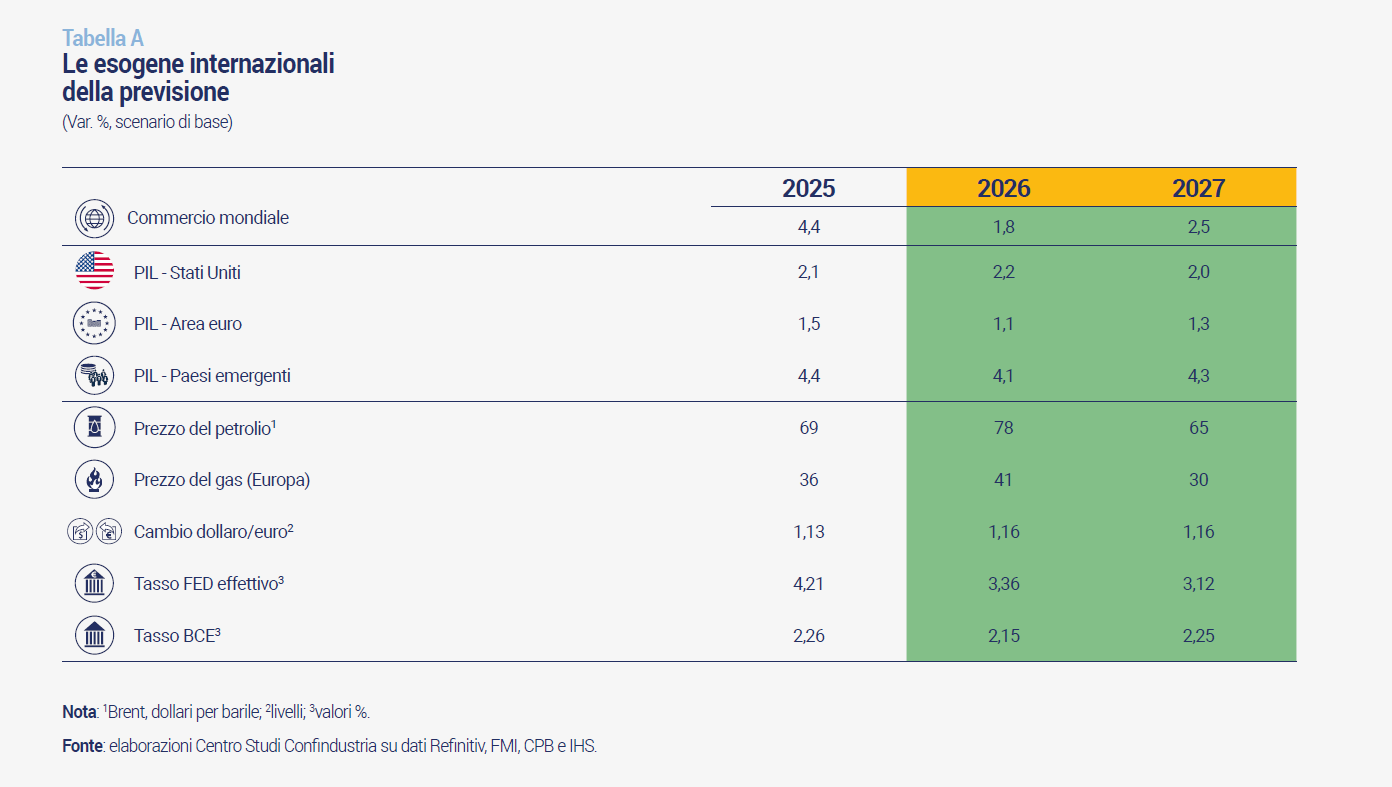
On top of this adjusting scenario, the conflict in the Middle East has set in, which adds uncertainty and will have other negative impacts on economies. The basic assumption of the CSC forecast for 2026 and 2027, which models all international exogenous variables (Table A), is that the conflict in Iran does not last beyond March. However, given that the international scenario has a high degree of volatility, two alternative scenarios have also been drawn, described in the Foreword, which assume a longer conflict in Iran (4 months and 10 months) and with worse consequences for the Italian and international economy.
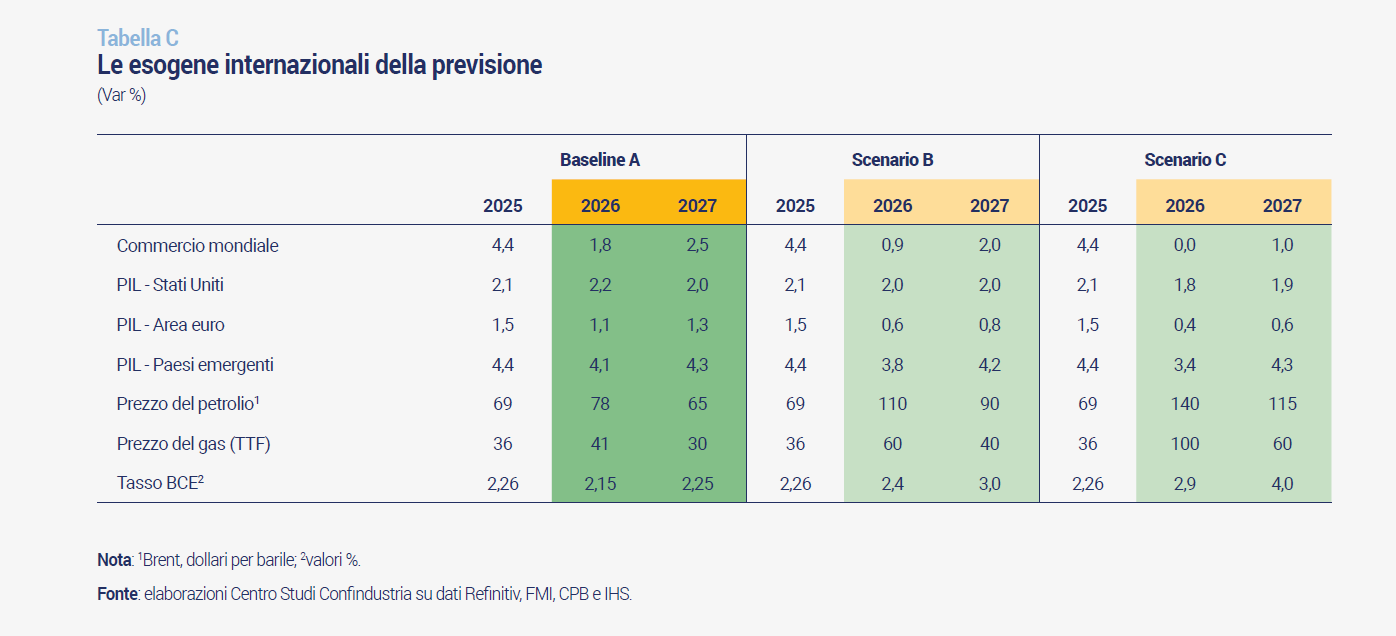
For oil, the baseline scenario assumes that the predicted pre-war global production abundance remains as the underlying trend and that the war, while weighing on oil availability in the short term due to the closure of the Strait of Hormuz, ends in late March allowing oil production to resume at rates close to pre-attack levels. The main impact of the conflict would be an increase in oil prices. Brent would rise on average to USD 78 in 2026 (from USD 69 in 2025) and then fall to USD 65 in 2027. Compared to the October scenario, this implies an upward revision in 2026 of +$16. Similarly for gas, the bearish fundamentals of the global physical market would prevail again after the end of the war. The price in Europe would rise to EUR 41/mwh on average in 2026 (from EUR 36 in 2025) and then return to around EUR 30 on average in 2027. For 2026, this is an upward revision of +9 euro/mwh.
In the CSC baseline scenario, world trade in goods will grow at a modest pace in 2026 (+1.8%), although higher than incorporated in the Fall 2025 Report. The increasing negative impact of US tariffs will be offset, at least in part, by the continued reconfiguration of trade flows, particularly in Asia, while the war in the Gulf would have a limited negative effect due to its assumed short duration. Trade will accelerate in 2027 (+2.5%), on the pace of world GDP, which will grow at a slightly reduced pace, in the face of deep geopolitical tensions and uncertainty that remains very high.
US growth is expected at +2.2% in 2026, slightly above that of 2025, and slowing slightly to +2.0% in 2027. GDP momentum is mainly supported by resilient household consumption patterns and, to a lesser extent, by the contribution of investment. On the other hand, net exports are very uncertain, due to ongoing changes in tariff policies, and government spending is uncertain, due to the possibility of new shutdown periods. The US has become a net exporter of both oil and gas over time (although it continues to import certain qualities of oil), so it is not subject to shortage risks in terms of volumes and trade balance shocks, although it is still affected by rising energy prices. But these increases are more moderate than in Europe: gas because it has regional rather than global prices; oil because in the United States WTI is used as a reference, the price of which is moving significantly away from Brent and is now $15-20 per barrel cheaper.
The war in Iran has a major impact on the growth prospects of emerging economies. The extent of the slowdown passes through various channels: destruction of the production base in some economies, including Iran, which is the 12th emerging economy in terms of weight on world GDP; increase in gas and oil prices, to which China and India are more exposed; supply difficulties, due to the reduction in the extraction capacity of the Gulf countries and the impossibility of transiting goods, including non-energy goods, through the Strait of Hormuz. The impacts are heterogeneous between countries, also because the increase in hydrocarbon prices produces beneficial effects for exporting countries far from the Gulf, such as Russia and Nigeria. In aggregate, the CSC's baseline scenario assumes that emerging market growth will slow to +4.1% in 2026 (from +4.4% last year) and then rebound to +4.3% in 2027.
For the Eurozone, the CSC's baseline scenario assumes GDP growth to slow to +1.1% in 2026, after +1.5% in 2025, due to the negative evolution of the global geopolitical scenario. This will be followed by a recovery to +1.3% during 2027. Eurozone growth is higher than that of the three largest economies (Germany, France, Italy), thanks to the vigorous contribution of the Spanish economy and some smaller countries. Looking ahead, the Area's performance will depend heavily on the contribution of Germany, which is trying to restart thanks to huge fiscal stimulus plans. Among the components of domestic demand, consumption is the most stable element, while investment remains the one with the least clear trend. Net exports have clearly incorporated the worsening effect of tariffs in the second half of 2025.
Financial markets were signalling until February a stability of rates in the Eurozone this year and next, no longer a downward bias as six months ago. After the outbreak of war in Iran, however, interest rate futures rose again, indicating a reversal by the ECB. The CSC baseline scenario incorporates these indications and assumes that in the Eurozone there will be a 0.25 hike by December 2026, followed by a phase of stability in 2027. This means that there will be no monetary stimulus to domestic demand in the European economy. The risks are high: depending on the duration of the conflict and the impact on prices, the ECB could raise rates further.
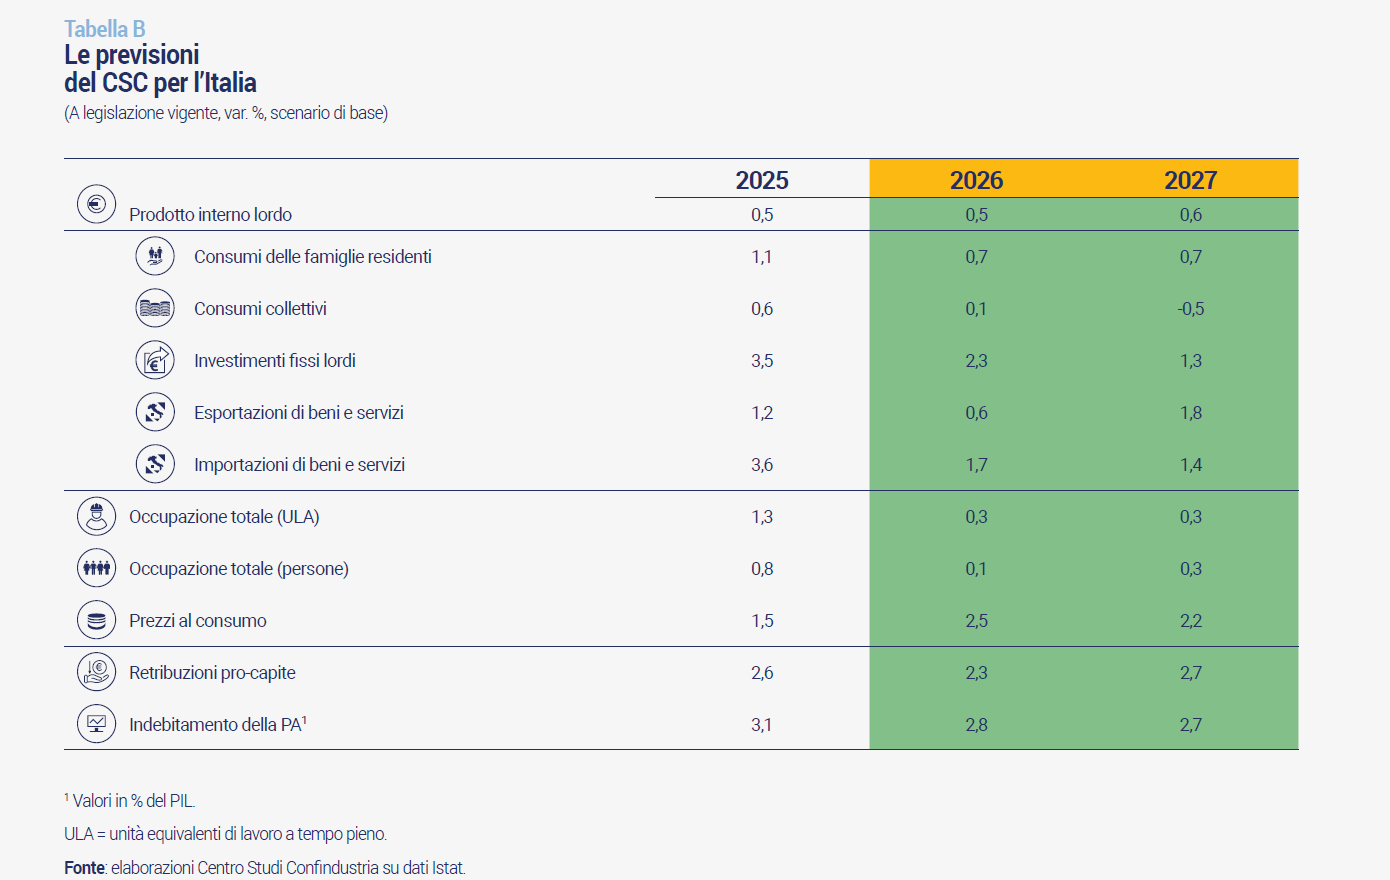
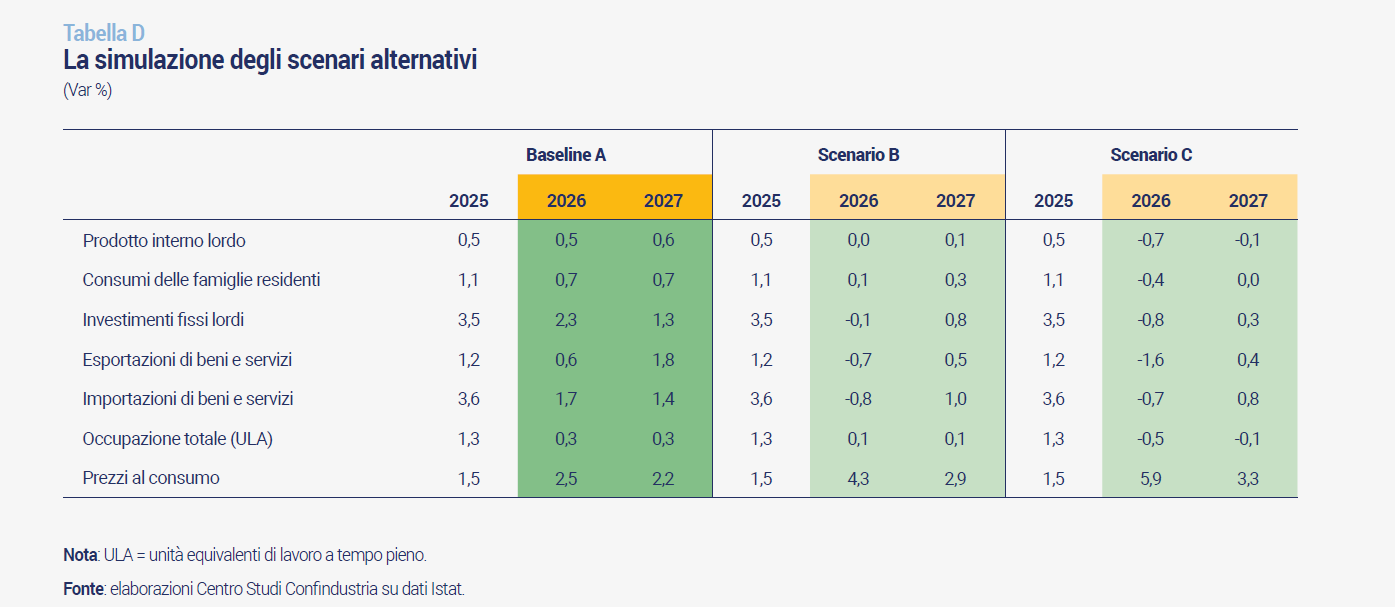
2. According to the CSC's baseline scenario, growth in Italy in 2026 will be +0.5%, -0.2 percentage points lower than forecast last October (Table B). This downward revision reflects the effects of the war in the Middle East, which broke out at the end of February 2026 and was incorporated in the baseline scenario lasting until the end of Q1. On the other hand, Italy's GDP is estimated to stagnate if the war lasts until Q2 (alternative scenario B), or even to fall into recession if the conflict lasts until Q4 (alternative scenario C). The base scenario, therefore, is exposed to significant downside risks that have a non-negligible probability, also because the underlying assumptions are in any case to be considered optimistic. In 2027 the Italian economy is expected to recover only moderately (+0.6%), in the baseline scenario, remaining at a very moderate pace. Growth will still be driven by household consumption and investments, to which will be added a slight positive contribution from net exports, favoured by the improvement in terms of trade expected next year.
In addition to the downside risks related to the war in Iran, there are others, related to the implementation of the PNRR, a possible further devaluation of the dollar, the continuation of high uncertainty, and the possibility that even the FED rate cut will fall short of expectations.
The data for Italy at the end of 2025 turned out to be better than expected: the statistical inertia with which GDP entered 2026 (+0.3%) was supported by consumption and especially investment, while net exports made a negative contribution. In the first two months of the year, before the war, indicators on economic activity pointed to a moderate strengthening.
The surge in energy commodity prices affects the Italian economy first and foremost through higher inflation, as we will see from the April data. In the CSC's baseline scenario, inflation is expected to rise sharply over the course of 2026 from the lows of the beginning of the year, peaking near +3.0%. On average, it will stand at +2.5% (from +1.5% in 2025), an upward revision of +0.7 points compared to the estimate included in the October scenario. In 2027, on the other hand, inflation is expected to slowly return to more moderate values as the change in energy prices is absorbed: on average, it is expected at +2.2%.
Italian household consumption will slow down to +0.7% in 2026, in real terms, and then confirm the same moderate pace in 2027, despite a worse entry in the year. This slowdown comes after better-than-expected growth in 2025 (+1.1%). In addition to the loss of purchasing power due to the inflationary flare-up, household spending will be restrained for much of 2026 by a further increase in the propensity to save, due to the surge in uncertainty with the outbreak of war in Iran. Conversely, less inflation, less uncertainty and less saving are expected to give respite to household demand next year.
The real disposable income of total households in Italy, adjusted for price dynamics and taxation, rose sharply in 2025: +3.1% trend in Q3, 6.1% above the 2019 level. This did not translate into an equal increase in consumption, which grew by only +0.8% trend in Q4 2025. Two reasons. Uncertainty has risen a lot, to higher than pandemic levels, and this usually leads to an increase in households“ propensity to save. Total income has risen in large part because financial income has risen a lot, mainly received by wealthier households, which have greater financial wealth and a lower propensity to consume: thus, the share of income saved has also risen due to a ”composition effect' between households. It should be remembered that low-income households have been the main beneficiaries of public interventions to support purchasing power.
After two years of decline, Italian exports of goods and services returned to growth in 2025 (+1.2%), exceeding expectations conditioned by US duties and geopolitical uncertainty. Net exports, however, were largely negative. In the first part of 2026, trade will suffer from the knock-on effects of the Iran conflict: a slowdown in global demand, a drop in confidence, a jump in energy prices and transport costs, and price increases in raw materials and other supplies from abroad. In the CSC baseline scenario, Italian export growth will slow to +0.6% in 2026. In 2027 it is expected to rebound to +1.8%, at a low pace compared to pre-pandemic levels. The contribution of net exports to GDP growth will remain negative in 2026 and will only turn slightly positive in 2027.
With regard to fixed investment, the outlook for 2026-2027 remains positive, but with annual growth rates expected to decline to +2.3% and +1.3%, after the excellent momentum recorded in 2025 (+3.5%). The expected moderation in investment expansion reflects two factors. Firstly, the high geopolitical uncertainty, which is causing caution among companies with regard to the start of new investment projects and is also bringing with it increases in energy commodity prices and a marginal rise in rates in Europe. Second, the contributions of public policies providing incentives for investment (especially in machinery) and those supporting infrastructure upgrades are both set to decline gradually over the two-year forecast period.
In recent years, Italy, unlike in the past, has been characterised by relative political stability, which is linked to the length of time the government has been in office, but also to the commitment of successive governments since the pre-pandemic in maintaining a virtuous public budget policy, respecting the parameters of the Stability and Growth Pact, and proceeding with determination to implement the PNRR. These elements have allowed the country to be perceived positively by financial markets and rating agencies, which are improving their assessments of Italy, increasing the climate of confidence around the country. This is leading to a drop in the yield on Italian government bonds and thus: a reduction in PA interest expenditure; a lower cost of credit for businesses, worth between EUR 0.5 and 1.4 billion; a better stock market performance: +28.4% in December 2025 from December 2024, more than in Germany and the US. It is important, also in the coming years, to be able to have stable governments and to maintain a shared determination across political forces on some crucial points of government action.
On the supply side, Italian industry activity showed signs of recovery in the last months of 2025, growing at +0.3% per year in terms of added value. Manufacturing activity benefited from increased investment in plant and machinery, but was held back by the uncertain international environment and trade barriers. Moreover, although consumption of goods grew, on the external side imports increased more than exports of goods. There is more heterogeneity between industrial sectors, compared to the widespread decline in 2024: the growth sectors rose from 4 to 10, but there was still a marked decline in some sectors, such as automotive and textiles-clothing. In addition to weakening demand, the war in Iran will further raise production costs and risk dampening the signs of recovery shown by indicators in early 2026.
After the strong expansion of recent years, employment growth in Italy shows signs of slowing down. In 2026, in the CSC's baseline scenario, AWUs remain almost stable (+0.3% per year on average, for drag). With GDP growth slightly stronger but in a context of high uncertainty, the increase in labour input will occur only on the intensive margin: +0.3% hours worked per capita, +0.1% the number of employed persons. In 2027, the moderate acceleration of economic growth, together with the gradual return of uncertainty, will favour a resumption of employment expansion on the extensive margin: +0.3% the number of employed persons and +0.3% the number of AWUs, with stable hours worked per person employed.
The dynamics of labour input will favour a moderate recovery in productivity, which is expected to grow by 0.3% per year on average over the two-year period. In the CSC's baseline forecast, the advance in labour productivity will continue in industry in 2026-2027, albeit at a very moderate pace, thanks to labour input dynamics remaining below that of value added. In construction, a further narrowing of the accumulated gap between labour input and value added, which started in 2024, is expected to remain positive. In services, on the other hand, labour input will grow in line with value added, with productivity essentially flat.
The broad and prolonged expansion of employment in the past few years has gradually reduced the unemployment rate, which fell to a record low 5.1% in January 2026. The unemployment rate is expected to rise to 5.8% in 2026, a level at which it will also remain in 2027.
The dynamics of “de facto” per capita wages in the Italian economy as a whole accelerated to +2.8% in 2024 (from +1.8% in 2023) and +2.6% in 2025, at current prices. This pace is also expected to average in the two-year forecast period, with +2.3% in 2026 and +2.7% in 2027. In real terms, however, wage growth remains very weak: the rise in inflation expected in 2026, linked to the new conflict in the Middle East and the resulting effects on energy and imported goods prices, significantly reduces the rise in the purchasing power of wages. Real wages are therefore expected to remain almost stagnant in 2026 (+0.1%), rising again moderately in 2027 (+0.6%).
The general government deficit falls below 3.0% of GDP, to 2.8% in 2026 and 2.7% in 2027, allowing the exit from the excessive deficit procedure. Fiscal policy will remain moderately restrictive and the implementation of the NRP will continue. Public debt increases to 138.7% of GDP in 2026, mainly as a result of stock-flow adjustments still linked to construction credits, and then declines in 2027 to 138.0% due precisely to the marked reduction in their impact on debt.
3. An important stimulus for Italian growth in the coming years may come from an increase in national defence spending. The increase is foreseen in the June 2025 NATO agreement: from the current actual level of 1.5% of GDP, it will rise to 3.5% in the decade from 2025 to 2035.
The CSC has developed six alternative scenarios to estimate the impact on GDP growth. Scenario 1: The expenditure increase is split between current expenditure and investment, following the current split (around 60% and 40%). In scenario 2, a cumulative 0.45% improvement in productivity in the economy is added. In scenario 3, the increase in spending is concentrated on investment. Scenario 4 adds the productivity increase assumption to 3. Scenario 5 incorporates, in addition to what is included in 4, an increase in domestic production and thus a reduction in imports. Scenario 6, conversely, incorporates scenario 1 and adds an increase in imports. The latter is the “worst” from the point of view of GDP stimulus, Scenario 5 is the “best”, while Scenario 1 is the “central” one, with no additional assumptions.
If the increase in spending is realised (scenario 5) by focusing on investments, positive spillovers are generated on the entire economy's productivity, and the increase in imports is limited; in this case, a significant positive impact on the Italian economy is determined: +3.0% cumulative with respect to a scenario without the Defence Plan, higher than the +1.5% in the central scenario (1) and the +0.9% in the unfavourable scenario (6). Despite the increase in public spending, the impact on the deficit-to-GDP ratio is modest in the worst-case scenario, almost nil in the central scenario, and becomes favourable in the best-case scenarios: this is due to strong growth in nominal GDP, employment and tax revenues. The multiplier varies significantly across scenarios, rising from a low of 0.8 in the worst-case scenario (scenario 6), to 1.5 in the “central” scenario (1), to a high of 2.0 in the best-case scenario (5). Fulfilling the obligation under the NATO agreement can be an important driver for innovation and growth in the country.
4. Young people are an increasingly scarce resource for the Italian economy. In 2025, the incidence of young people (15-34 years old) on the total population is at 20.6%, down sharply from 25% in 2005. In 2070, according to ISTAT projections, it will fall to 18.6%. Given the demographic decline, the share of the population of working age is also set to decline significantly, with a loss of 5 million as early as 2040.
Compared to their European peers, young Italians are less employed, especially in the lower age groups (15-24 year-olds). In 2024, only one young person in five was employed (19.7%), compared to more than one in three in the Eurozone average and more than half in Germany (51.2%). Italy's relative position improves, however, in the 25-29 bracket and even more so in the 30-34 bracket. The low employment rate among the youngest reflects in part the longer education paths but is also the result of persistent territorial gaps, although in recent years the South has shown signs of catching up.
The difficulties of young Italians in finding employment persist even when they have completed their education. In 2024, among 20-34 year-olds with a diploma or degree, in Italy only 67.6% were working within three years of completing their education, compared to 81.0% on average in the Eurozone and 90.4% in Germany. Education pays (in terms of employment opportunities and wages) but less than elsewhere, despite the fact that Italy has a relatively low share of young people with tertiary education (30%, 10 points less than Germany and 20 less than France). The phenomenon of international mobility of qualified young people fits into this context. Over the past five years (2019-2023), more than 190,000 young Italians have left the country and about half of them held a university degree. One tenth of young Italian graduates moved abroad, with particularly high incidences among engineers and computer scientists, profiles for which companies report growing shortages. The international mobility of workers can foster the exchange of knowledge, the dissemination of technologies and the creation of economic links between countries, but in order to translate into a strengthening of national human capital it is important to encourage the return and attraction of young talent from abroad; in this direction, the favourable tax regimes introduced in recent years in Italy also fit in.
Italian public policies aimed at youth employment have focused in recent years on labour demand incentives. Hiring rebates and bonuses act mainly on the labour cost side for companies, but have little effect on the structural determinants of low youth employability. In particular, without an effective policy of alignment between skills coming out of the education system and those required by the market, the skills mismatch remains as an obstacle to the full integration of young people into the labour market.
What is needed is an integrated long-term strategy with structural interventions that address the root causes of young people's employment difficulties, such as:
1. Reform and strengthening of training and educational pathways;
2. Anticipation of labour market entry during education;
3. Incentives aimed at supporting the income of young workers;
4. Accompanying policies and active welfare.
An organic policy aimed at enhancing and retaining human capital would to all intents and purposes constitute an industrial policy lever, geared towards strengthening the innovative capacity of the production system and supporting the country's economic development in the long term.
5. Italian foreign trade is resilient to repeated and unpredictable shocks. Italy's foreign trade is currently facing a paradigm shift: the decoupling between the two largest economies (US and China), tariffs and other barriers to entry in the US market (the main extra-EU destination of Italian products), the pressure of China's overproduction (the largest extra-EU supplier), with rising volumes and falling prices.
What are the first indications of the Sino-US double shock on Italian trade dynamics in 2025? What are the prospects in the medium term?
In 2025, trade with the US and purchases from China were driven by a small number of products, mainly in the pharmaceutical industry. The negative impact of US tariffs, however, is already visible in many manufacturing sectors. The criticality of Chinese supplies, on the other hand, is concentrated in specific supply chains, such as electric cars and clothing.
The outlook is difficult. The new, highly uncertain US tariff framework further penalises many Italian products. Chinese overproduction continues to extend beyond the mature sectors to medium and high-tech sectors.
The proven ability of internationalised Italian companies to redirect their purchases and sales abroad to mitigate supply risks and seize opportunities in new markets plays a positive role. It is crucial to focus on trade agreements with strategic partners (Mercosur, India, Mexico, Indonesia) to foster diversification in the most dynamic markets.
Concerning Italian trade with the US, in 2025 imports grew by 35.9% in value, exceeding EUR 35 billion; exports were close to EUR 70 billion (+7.2%). The acceleration of exports was caused by the unpredictability of US tariff policies, especially in sectors at risk of higher tariffs: for instance, pharmaceuticals recorded a +100% jump in purchases and +54% in sales to the US. Net of pharmaceuticals and other transport equipment (exceptional orders for high-value vessels), there was actually a decline in exports to the US in 2025, due to duties (-5.7% per year). At the end of 2025, double-digit losses were recorded in several sectors: for food and beverages, paper and printing, metals and metal products (affected by duties at 50% on steel, aluminium and copper), electrical appliances, furniture. The impact is expected to widen in the medium and long term as the possibility for US buyers to find alternative suppliers increases, albeit to a lesser extent in the case of high quality products such as those from Italy. With the duties under the bilateral agreement with the EU, the losses for Italian exports could exceed EUR 16 billion.
Further uncertainty was created after the US Supreme Court ruled on 20 February 2026 that the reciprocal duties introduced in 2025 were illegal, opening the way for appeals by importers on duties already paid, which the administration will have to refund. Thus, new erga omnes duties were introduced as of 24 February, of 10% additional to MFN (most-favoured-nation) tariffs, with a maximum duration of 150 days, extendable. Before the Supreme Court ruling, the overall “effective” tariff on US imports was 15.2%; with the duties at 10%, it dropped to 11.5%. If increased to 15%, it would stand at 13.2%.
The impact is heterogeneous per country and per product: countries that had higher duties before the ruling gain: Brazil, China (from 36.9% to 26.9%), India (from 22.3% to 13.9%). Countries that had negotiated reduced duties such as the EU (from 11.7% to 10.5% with duties at 10% and 12.5% in case of an increase to 15%) lost in relative terms. Italy is the European country most disadvantaged by the new duties: before the ruling, the ’effective“ tariff was 13.6%, lower than the world average; after, it rises to 12.6% with duties at 10% and to 15.3% if at 15%, exceeding the world average. There are 2,246 Italian products exported to the USA (14% of total exports), which with duties at 10% incur a tariff higher than that of the US-EU agreement; with duties at 15%, the products rise to 4,065 (31% of exports). They are less than 10% for France and Germany with duties at 10% and less than 20% with duties at 15%.
Concerning trade with China, the increase in Italian imports from China in 2025 (+16.4% in value, over 60 billion) was driven by: 1) pharmaceutical products (almost +1000%, +7 billion euro); the pharmaceutical supply chain is highly interconnected between Italy, China and the USA. The increase in imports from China is concentrated in hormones and, to a lesser extent, hormone- and steroid-based medicines; the increase in exports to the USA is driven by immunological (hormone-based) products and also by the same category of hormone- and steroid-based medicines; 2) motor vehicles (+63%, +1 billion). These are sectors in which the Chinese market share has grown a lot in recent years: from 2019 to 2025, +20 percentage points for both Chinese medicines and cars out of the total sectoral imports from non-EU countries. Net of these two sectors, imports from China remained substantially stable in 2025, at levels below the peak at the end of 2022.
The penetration of Chinese products in Italy is concentrated in medium and high-technology-intensive sectors (where competition is played out on quality and innovation) and strategic sectors. A re-composition of imports from China towards products with higher added value and higher average unit values (pharmaceuticals, motor vehicles, chemicals, machinery, electrical equipment, other means of transport) is underway. The share of medium- to high-tech products in China's total exports jumped from 28% in 2019 to 42% in 2024, while the respective share in Eurozone exports remained broadly stable at around 41% and the US was able to gain shares in the high-tech and oil & gas sectors.
Imports from China are also increasing in sectors where average unit values have fallen: in mature manufacturing sectors, such as textiles-clothing-leather, and in capital-intensive industries, such as metals. Chinese overproduction (due to still weak domestic demand, massive subsidies and lower demand from the US) is leading to an increase in Chinese exports to the world, especially to South-East Asia. Subsidies on certain products in China are driving the largest exports: according to the IMF, subsidies between 2009 and 2022 are responsible for about one sixth of China's export growth. In addition, subsidies to upstream sectors also make downstream industries more competitive. By way of example, steel subsidies are reported to have increased Chinese car exports by 3.5%.
EU countervailing duties towards China over the past 15 years have been concentrated in sectors with a strong presence of state-owned enterprises or intense state support (steel, aluminium, energy technologies and green transition products), but have not always produced the expected effects: in some cases, European production capacity is insufficient to meet domestic demand, making it difficult to reduce import dependence even in the presence of tariffs (e.g. lithium-ion batteries); in other cases, Chinese products remain competitive even with tariffs, thanks to economies of scale, vertical integration of production chains and the support of national industrial policy (e.g. electric cars).
To compete with China, it is necessary to enhance the strengths of the European production system (rather than price-based trade policies): product quality, innovation and specialisation in the higher-end segments. Therefore: an industrial policy aimed at strengthening the technological capacity, quality and competitive positioning of European companies in high-tech sectors is central; trade defence instruments must be used; the risks of supplying critical inputs, often geographically concentrated and on which there are trade deficits, must be managed at EU level.
Italian trade relies on diversification: a greater resilience of Italian exports in the face of shocks can be observed, thanks to a faster geographical re-composition of trade by our companies. Italian imports reached 12% per annum of recomposition in 2022-2023 and stabilised at around 9% in the last two years, at rates well above German imports. On the export side, around 8% of Italian products change destination every year, compared to 6% of German products. As regards sectors, on the import side, pharmaceuticals, oil and metallurgy led the recomposition of Italian trade in 2025; on the export side, pharmaceuticals, machinery and equipment made a greater contribution to the recomposition of Italian trade. As regards individual destination markets, in 2025 Italian exporters increased sales for some products and decreased them for others: almost equally in the USA, Germany and Switzerland; increasing shares in France and Spain, decreasing shares in Turkey. On the import side, the increase in the quotas of China and, to a lesser extent, of the USA, is the most important factor. It is essential to focus on trade agreements with partners such as Mercosur, India and Mexico, in order to promote diversification in dynamic markets.
FOREWORD
The war in Iran the main destabilising factor
The Italian, European and world economic scenario is, at the moment, strongly influenced by the war between the United States and Israel on the one hand and Iran on the other, which started on 28 February.
This is because Iran is not just another country: it is one of the most important oil-producing countries in the world; it is a strategic partner of Russia and China to which it sells arms (to Russia) and oil (to China); it is the main military power in the Middle East, with an army that is numerically about 3.6 times that of Israel; it is a major producer of war material (also an exporter, to Russia since the conflict in Ukraine in 2022); it finances, trains and supplies arms to armed groups that are part of the Shia-inspired Resistance such as Hamas and Hezbollah and the Houthis.
US and Israeli objectives in the war
With this war, the United States and Israel intend: 1) to zero out Iran's nuclear capability; 2) to eliminate the military threat to Israel, but also to other Middle Eastern countries that perceive Iran as a destabilising factor; 3) to topple the regime, to prevent the destabilisation of the region from recurring.
Some stylised facts
- Following the US and Israeli attacks, Iran is reacting by attacking US bases and military targets in all Persian Gulf countries: Saudi Arabia, Bahrain, the United Arab Emirates, Kuwait, Oman, Qatar and Iraq.
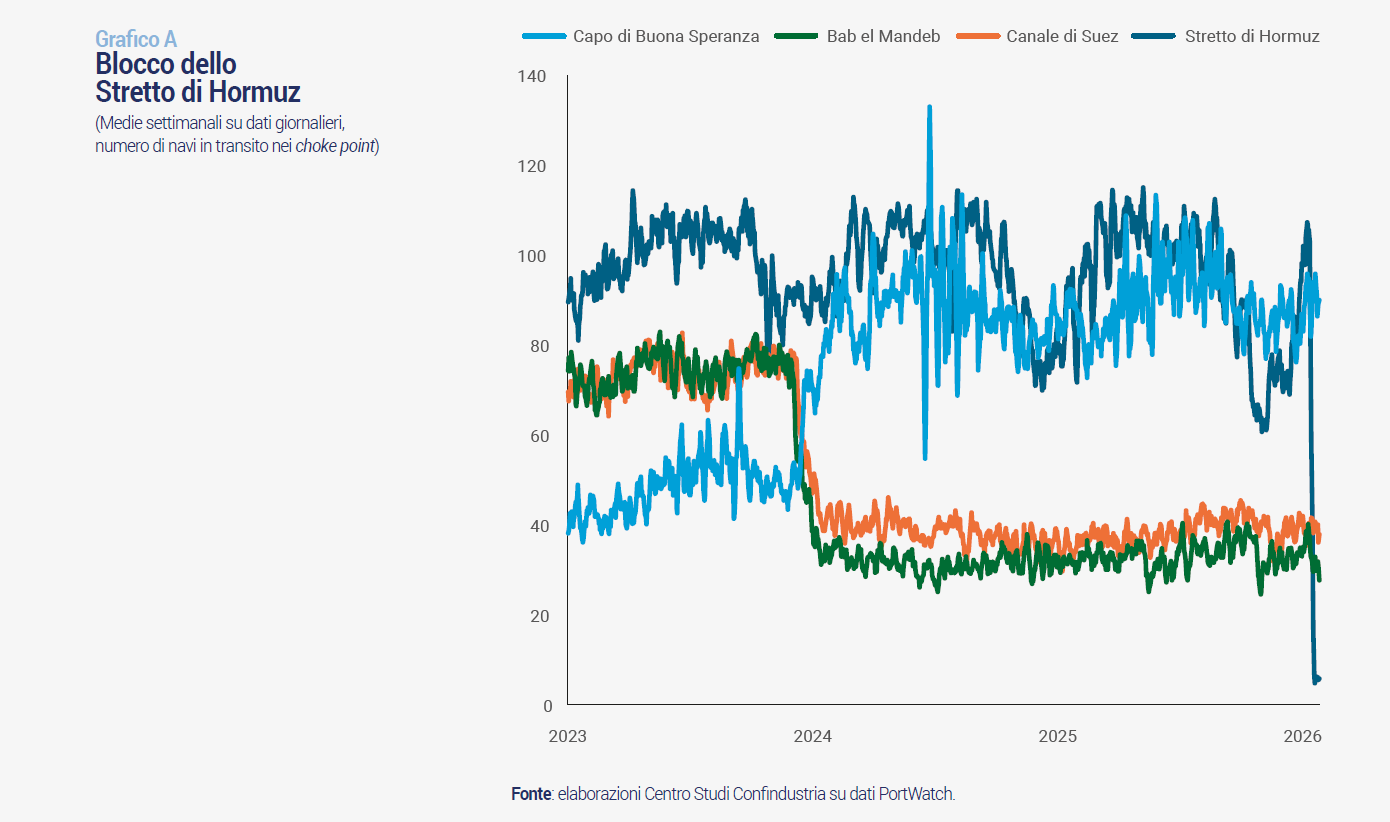
Taken together, the Persian Gulf countries were producing 24.5 million barrels per day (mbg) of crude oil before the war, rising to 29.8 mbg if other extracted petroleum liquids are counted. In all, their oil extraction amounted to 28% of the world total (106.3 mbg), of which Iran produced 3.3 mbg, Saudi Arabia 9.9, Iraq 4.3, United Arab Emirates 3.5, Kuwait 2.6 at the beginning of 2026. - The Strait of Hormuz, which is a crucial crossing point for the world's energy supplies, is now essentially closed and nobody knows when it will reopen (Chart A). Approximately 20% of the world's oil supply and 2.7% of the world's natural gas consumption (2024 figures) passed through the Strait of Hormuz by sea before the conflict. The blockade of a key passage for international transport puts the availability of crude oil at risk.
- How long can the world endure with the Strait of Hormuz closed? Assuming a drop in transits of 80% compared to pre-war, which seems consistent with the most recent data (about 95% in early March, but considering only vessels whose signal can be recorded), the world supply would be reduced by about 16 mbg.
To mitigate this deficiency, there are four types of “buffer” available:
World excess production: before the conflict, world oil production largely and persistently exceeded world demand. On average, excess production in 2025 was +2.7 mbg, which allowed for a significant build-up of commercial stocks.
Unused extraction capacity: in OPEC countries it is 3.6 mbg, but 3.3 mbg of this is in Saudi Arabia and also in Iraq, the United Arab Emirates and Kuwait. Only 0.3 mbg of additional production in other OPEC countries is to be considered immediately usable.
Pipelines capable of bypassing the Strait of Hormuz: in Saudi Arabia, the East-West pipeline allows the transport of 5 mbg, recently expanded to 7 mbg of oil overland from the Persian Gulf to the Red Sea. Another smaller pipeline, with a capacity of about 1.8 mbg, is the one in the United Arab Emirates that allows crude oil to be transported from Abu Dhabi to Fujairah in the Gulf of Oman, outside the Strait of Hormuz.
The transport capacity bypassing Hormuz is thus 8.8 mbg, even though the Fujairah terminal and the oil tankers docking there were attacked in recent days by Iran. Thus, it is reasonable to assume that some of the flow that previously passed through Hormuz will be available once these emergency pipelines are activated.
Strategic reserves amount to 415 million barrels in the US (an average tanker carries 2 million), 1,406 in European countries, 280 in other member countries of the International Energy Agency (IEA, total 2,101 mb). China has also accumulated strategic oil reserves, but outside the IEA system.
Overall, therefore, the loss of 16 mbg resulting from the closure of the Strait of Hormuz could fall to between 6 and 7 mbg considering only part of the pre-war excess production (2.7 mbg), the increase in production capacity in the other OPEC countries (0.3 mbg) and the use of pipelines at full capacity.
World oil demand will fall as the price rises, but the price consistent with this loss could still be very high given the rigidity of demand.
The available reserves could compensate for the 6-7 mbg lost with the closure of the Strait of Hormuz for about eleven months. But the unusability of the UAE pipeline alone is enough to increase the loss and reduce the duration of reserves.
It is clear that once reserves run out, with limited supply (the loss is about 6% of world consumption), the price will rise to a level that can reduce demand. But this level is likely to be such that motorists will not use their cars and will change other habits of daily life. So a price well above $150 per barrel, capable of causing a global economic crisis. - The price of oil rose in the first week from $71 to $89 per barrel and by about slightly less than 15% on average per week (50% in the first three weeks). Gas prices rose by almost 25% on average per week (over 90% in the first three weeks) but remain at much lower levels than 2022.
The major world oil crises of the past have all had their epicentre in the same region: the Yom Kippur War between Israel and neighbouring Arab countries in 1973; the Islamic Revolution of 1979 with Khomeini's rise to power, followed by the eight-year war between Iran and Iraq; the First Gulf War of 1990 that followed the Iraqi occupation of Kuwait and lasted about seven months; and the Second Gulf War of 2003 with the occupation of Iraq by a US-led coalition and the ousting of Saddam Hussein (after about a month). In past wars, the price of Brent rose from $16 to $42 per barrel between 1979 and 1980 (+156%) and tripled in two years with the outbreak of the Iran-Iraq war; from $17 to $36 in 1990-1991 (+107%), from $24 to $33 in 2003 (+34.7%), which was the episode in which large-scale war operations lasted the least.
- To contain the rise in oil prices, the IEA countries released 412 mb of strategic reserves on 11 March. In parallel, the US suspended its planned sanctions on oil purchases from Russia for one month. This will allow Russia to sell the crude oil it produces at market price, instead of underpricing it as it has done since the sanctions began.
- In enlargement, the difference between the price of WTI (West Texas Intermediate) used mainly to price oil produced in North and South America and the price of Brent used to price oil in Europe (including Russia), Africa and the Middle East. While usually the difference between the two is minimal and stable over time. The price of WTI was $52 on average in December 2025 and rose to $95 on 19 March, a gap of -$20 compared to Brent (from -$4 in 2025). This means that the price increase is higher in areas, such as Europe, that rely on Brent. As far as gas is concerned, the price in the different areas of the world is also very different as it is still partly linked to local pipeline supplies, despite the strong growth of LNG in recent years. In Europe, the price is substantially always higher than in the US (in March, it was about five times that of the US).
- Transits through the Suez Canal were broadly stable, but well below those recorded in 2023 before the Houthi attacks. Since the beginning of 2024, the Suez Canal and, consequently, the Bab el-Mandeb Strait have halved ship traffic compared to the 2023 average. Currently, transits remain at the average levels of 2024, at 47% for the Suez Canal and 55% for the Bab el- Mandeb Strait compared to the average values of 2023 before the Houthi attacks began. This situation led to a sharp increase (+80%) in the use of the alternative route circumnavigating Africa via the Cape of Good Hope, which is longer and more expensive in terms of transport.
- Freight costs up, but not marked. Freight costs rose as a result of the war, but not as markedly as in early 2024 following Houthi attacks on merchant ships passing through the Bab el-Mandeb Strait in the Red Sea: the Baltic Dry Index, which relates to non-containerised commodities, +15.9% in the average of the first nineteen days of March compared to January; the Drewry World Container Index, the indicator relating to the transport of containerised goods, +13.2% in the last month; the increase is most pronounced for the Shanghai-Rotterdam (+17.5%) and Shanghai-New York (+19%) routes.
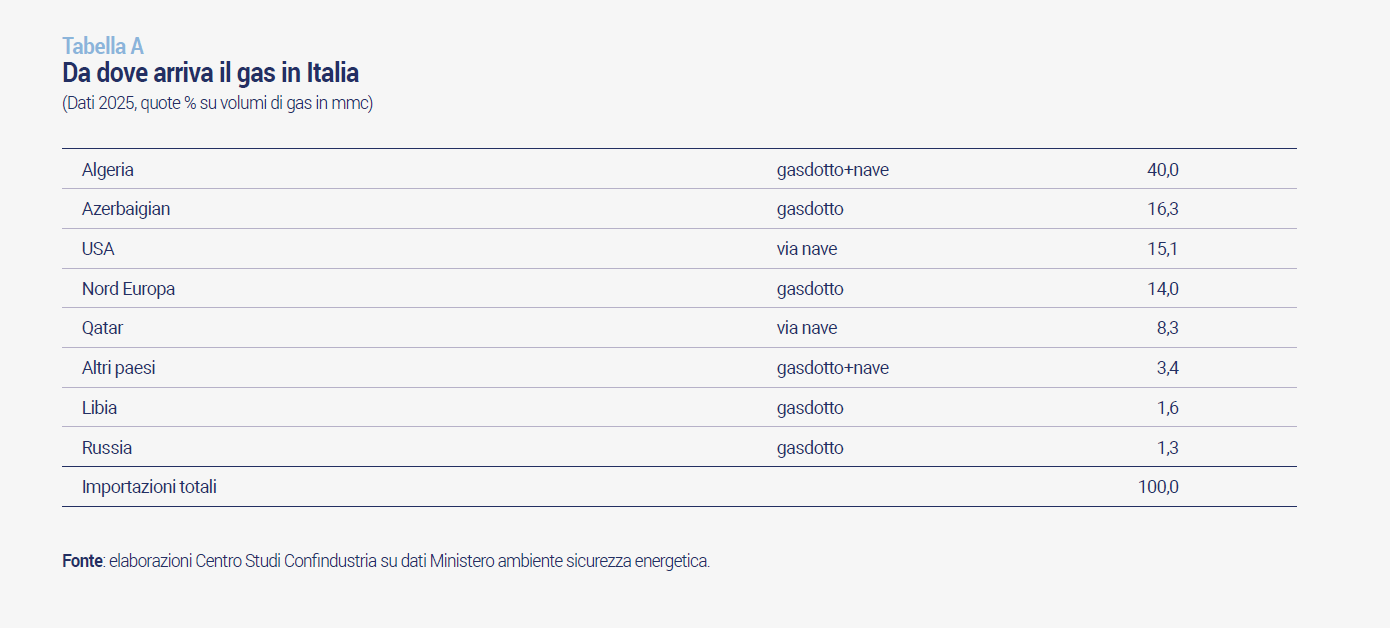
- Italy imports significant shares of gas and oil from Gulf countries. For oil, Italy imports a lot from Iraq and Saudi Arabia, less from Kuwait and other Gulf countries, totalling 16.6% of Italian crude oil imports (2024 data). For gas, Italy's flows from Qatar (LNG by ship) amounted to 8.3% of total gas imports in 2025, plus 16.3% (by land) from Azerbaijan, which borders Iran to the north, but is not on the Persian Gulf; the main gas supply, in fact, comes from Algeria (32.8%), with a major share from the USA (15.1%; Table A).
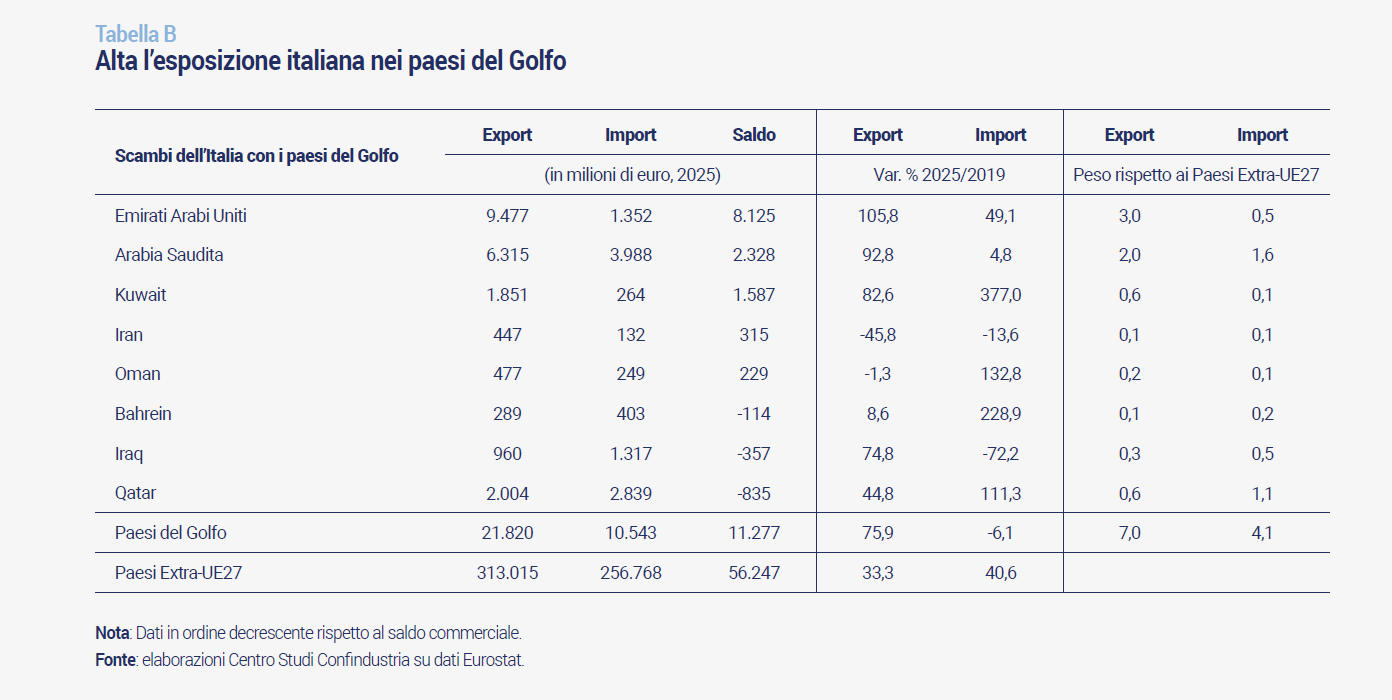
- Italy's exports have grown in recent years with the Gulf countries (Table B). Two sectors account for 86% of our total purchases, which amount to 9.1 billion in 2025: mineral fuels and related refined products, which with 7.6 billion account for 72%, followed by base metals, which account for 13.5%, almost one and a half billion. As for exports to the eight Gulf countries: 21.8 billion in 2025 (trade balance +11.3 billion). From 2019 to 2025, Italian exports to the eight Gulf countries increased (+76%, cumulative) more than twice as much as the growth recorded towards the total non-EU countries (+33%). In particular, Italian sales to the United Arab Emirates and Saudi Arabia, which account for almost three quarters of the total exported to the Gulf countries and 5% of those to non-EU countries, have doubled over the last six years, offsetting the decline in sales to other markets (e.g. Germany). The top five sectors absorb more than half of Italy's goods exports to these countries: machinery (6 billion) accounts for 28% of the total and more than 80% is directed to Saudi Arabia (36.4%), the UAE (32.2%) and Qatar (14.5%); other manufacturing products (excluding furniture) account for 2 billion, 80% is destined for the UAE; electrical appliances (1.3 billion), also destined for the UAE (41.5%), Saudi Arabia (34.1%), followed by Qatar (8.7%) and Iraq (8.5%) pharmaceuticals (1.3 billion) with the main destinations being Saudi Arabia (58%) and the UAE (25%); and base metals, same level of exports (1.3 billion) and same main countries but with reversed shares in the UAE (55%) and Saudi Arabia (20%).
- The major Asian economies are heavily dependent on energy supplies from the Persian Gulf countries. More than 42% of China's oil (crude oil and oil products) purchases and 24% of natural gas purchases come from the Gulf area (Unctad data, 2024). For India, the import share from the Gulf is similar for oil (43%) and much higher for gas (78%). Oil dependence is even higher for advanced Asian countries: Japan (84% oil -almost total for crude-; 10% gas) and South Korea (67% oil, 31% gas).
- The global uncertainty indicator, as measured by the World Uncertainty Index (IMF), rose slightly in February compared to January (+4.9%), but is expected to rise further in March. In this direction went the US daily indicator of economic policy uncertainty, which increased by more than 18.5% in the first fortnight of March compared to the February average. It should be noted that these increases occur in a context where the overall level of uncertainty was already high, higher even than during the pandemic.
- Economies are much less dependent on oil than they were in past decades. Indeed, oil intensity, measured as “barrels of oil per one euro of GDP”, has more than halved in the last 45 years (0.66 in Italy in 2024 from 1.60 in 1980). Similar numbers apply to other European countries; oil intensity remains slightly higher in the US (0.89 in 2024) than in Europe, but even there, it is falling compared to the years of previous world oil crises. For this reason, almost all analysts agree that the economic impact of the war in Iran will be lower than in past oil crises.
- After three weeks of war, the markets are betting on a short and not overly destructive war (oil futures indicate an oil price for December broadly similar to that of February). This is because markets are discounting the US and Israeli governments' awareness of the possible consequences of a prolonged global shortage of oil and gas. However, the continuation of war or otherwise instability in the area may radically change the markets' perception and the impacts could become very negative.
- In recent days, the energy (oil and gas) infrastructure of Iran and, in response, of other Gulf countries is also affected by acts of war. Some have suspended operations, others are damaged. The experience of Iraq, post-Gulf War II, suggests that the return to full operation of damaged facilities takes a medium to long time. Back then, some major infrastructures were repaired in 6-18 months, but the full production capacity and stabilisation of the industry took almost 10 years (also due to attacks and sabotage).
- American and Israeli bombings have destroyed military targets and eliminated some of the country's leaders, but have not changed the leadership. Despite the American and Israeli attacks and bombings, the Iranian regime still has the ability to strike targets in other Gulf countries.
Key variables underlying the economic impacts of conflict
1. The duration of the war. This is the main variable because the war will keep global uncertainty very high. It also keeps the risks of destruction of refineries and energy infrastructure high and the reopening of the Strait of Hormuz to allow the passage of oil tankers and ships carrying other goods difficult. The longer the war and the closure of the Strait of Hormuz goes on, the more difficult it will be to secure the world supply of oil and gas. This implies a gradual increase in their prices. The continuation of the war makes international transport more and more expensive in parallel with the rise in oil prices, and transport with the countries involved in the war and thus trade more and more difficult, with inevitable consequences for the exporting countries. In addition, the countries of the Arabian Peninsula and, in particular, Qatar and the Arab Emirates, have assumed a crucial role as a hub in international transport, especially between Europe and Asia, and in the international financial system. A prolonged duration of the war would put this role at risk, with repercussions also at the global level.
2. The share of oil and gas production capacity that will be destroyed. Even if the war lasted only a short time, within four weeks, but a large share of refineries and oil extraction facilities were destroyed, given the medium to long time required for restoration, there would still be a worldwide shortage of oil and gas supply. In this case, the effects would be limited to the availability of energy raw materials and their price, but the global macroeconomic impacts would still be very significant.
3. The outcome of the war. The desirable outcome of the war would be to provide some stability for Iran and the entire region. But even if the war ended in a short time and oil and gas production capacity were to be preserved almost intact, should the current Iranian regime remain in power, it is very likely that strong instability will persist throughout the area, not only in Iran. On the other hand, even regime change, as the experience in Iraq has shown, may not necessarily mean more stability, at least in the medium term. Instability would keep the risks connected to the passage of ships through the Strait of Hormuz high, and so would the risk of sabotage of oil installations. The central international role of Qatar, the Arab Emirates and Saudi Arabia would also be at risk.
Channels of impact on the economy
1. The war increases uncertainty, which is already at very high levels, higher than those of the pandemic. This has a negative impact on the choices of businesses and households, reducing consumption and investment.
2. One of the most significant effects is the increase in energy prices, given the importance of oil and gas production in the countries involved. This shock, if it is short-lived, may remain temporary and lead to a direct increase in inflation, which would then recede once prices fall. But if the price increase continues, inflation will also increase due to second-round effects, which occur when energy price increases are incorporated into other goods and services produced, pushing up core inflation as well. Higher inflation reduces real disposable income and thus household demand. Higher energy costs create higher production costs for companies and lower competitiveness of goods especially where energy prices rise the most.
3. Rising oil and gas prices are also driving up international transport costs, which add to increases in the cost of energy, driving up production costs and curbing the export of goods. For the time being, the increases are still moderate.
4. Supply difficulties. The closure of the Strait of Hormuz and the damage to some refineries and energy infrastructures, as mentioned above, will create a global shortage of oil and gas should it continue. These supply bottlenecks will affect the world in different ways. The countries most dependent on oil and gas from the Persian Gulf countries will find it more difficult to replace them and, as months go by, will risk seeing their availability reduced, which will also have a significant negative impact on production capacity. China, but also the other advanced Asian countries (Japan and South Korea), are the most affected in this respect. Since Chinese production is practically equal to the sum of European and American production, and Chinese supplies are essential for both areas, the risk that supplies of intermediate goods and raw materials in Europe and the US will be disrupted is high, especially if global oil and gas shortages become more acute (continued closure of the Strait of Hormuz and/or destruction of oil and gas production facilities). The risk of production stoppages in Europe caused by supply difficulties is a real risk in the medium to long term.
5. Through exports to the Gulf countries. The impact of the war on exports to the Gulf countries could be negligible if the war is short and ends with greater stability in the region. The longer the war lasts, i.e. the greater the instability in the area, the more difficult it will be for the foreign demand of the Gulf countries to be preserved and to be satisfied.
Three alternative scenarios on the conflict: the hypotheses
To estimate the magnitude of downside risks to economic growth in the current situation, triggered by the war in Iran, the CSC identified three alternative scenarios. One is the one used as a baseline in the rest of the report.
The other two scenarios (Table C) are worse than the baseline, both for the international scenario and, consequently, for the impact on the Italian economy. There are three hypotheses distinguishing the scenarios:
1. the duration of the war in Iran: the baseline scenario (A) assumes a conflict limited to March 2026, Scenario B that the war continues until June 2026 (i.e. lasts four months), Scenario C that it lasts throughout 2026 (i.e. lasts ten months). In all three scenarios, it is assumed that the Strait of Hormuz remains substantially closed during the war (i.e. transits drop by at least 80% compared to before the war), but reopens permanently with the end of the war.
2. the share of oil and gas production capacity that will be destroyed in the Gulf countries: in the baseline scenario, it is assumed that production capacity remains adequate to support world supply. Even in the other two scenarios in which the conflict is prolonged, it is assumed that the destruction of additional facilities in neighbouring countries will gradually decrease to zero as Iran's offensive capacity is reduced.
3. the outcome of the war: in all three scenarios, it is assumed that with the end of the war, stability is guaranteed in Iran and in all Gulf countries. This implies that the risk of sabotage and attacks is low and that trade flows to and from the Gulf countries may return to the pre-war situation; a different direction of trade between Asia and Europe as a geopolitical consequence of the ongoing conflict is ruled out.
Consumer price increases in Italy
The weight of energy in the Italian consumer price basket is 10.7%, of which 4.7% are transport fuels (petrol, diesel) and 6.0% household energy (electricity, gas). Thus, for every 10% of price increase in petrol and other energy products in Italy (due to the jump in international commodity prices), there is a slightly more than +1.0% increase in inflation in Italy, traditionally within 1 month of the shock.
In the baseline scenario, the price increase of oil and gas prices taken together, expressed in euros, in 2026 is assumed to be +12% compared to 2025, but in scenario B it goes up to
+60% and in scenario C it even rises to +133%. This means, mechanically and for the direct impact on end-consumer energy prices alone, a potential increase of over +13 points in inflation in the worst-case scenario compared to 2025 (+6 points in B). For comparison, in 2021-2022 Italian inflation jumped from approximately zero to +12%, i.e. +12 percentage points from the minimum to the maximum calculated in monthly terms.
To this direct impact must be added the second-round effects, i.e. the price increases of non-energy goods and services incorporating the increase in energy costs, which, looking at past historical regularities, in Italy develop within about 6 months of the initial shock.
Conversely, the reduction in demand caused by such a shock tends to dampen domestic prices, mitigating the actual increase in the general price index compared to the exogenous magnitude of the commodity shock. Possible mitigation measures of actual “on-bill” prices (e.g. implemented with the 2022 energy shock) should also be considered, in addition to the smoothing carried out by the Authority on regulated energy prices.
ECB rates rise
In the two alternative scenarios, the ECB is forced by the jump in inflation across Europe to raise rates more broadly than the quarter-point hike incorporated in the baseline scenario. A move that was certainly not contemplated before the Iran war. In scenario B, official rates in the Eurozone rise by a total of 1.0 percentage point in 2026. While in scenario C by 2.0 percentage points, cancelling out all the easing that Frankfurt had achieved between 2024 and 2025. This increase would again dampen the credit channel in Italy, for businesses and households, penalising both investment and consumption. The tightening would fully impact the economy with a delay of several months; therefore, the negative effect on investments in particular would occur not only in 2026, but also in 2027.
Eurozone: growth threatened by prolonged conflict
As a net importer of oil and gas, the Eurozone is particularly exposed to rising energy costs.
The great heterogeneity of the various Eurozone countries in their exposure to the oil and gas shock should be noted: among the top four, based on energy mix, Italy is the most exposed country, followed by Germany, while France is less exposed, given its high share of nuclear power. The CSC scenarios take account of this situation, on which energy price increases are grafted, and therefore record a greater impact of the shock on the Italian economy, compared to the Eurozone aggregate, in all three scenarios.
In the intermediate scenario, for the Eurozone, the repercussions would extend both to the current year and to 2027. A moderate increase in rates would significantly discourage investment and industrial activity. In this context, growth in the area would fall to +0.6% in 2026 and +0.8% in 2027.
In the pessimistic scenario, even more pronounced inflationary risks would emerge, leading to higher interest rates. This would have stronger effects on domestic demand: investment would be penalised by the high level of rates, while consumption would suffer from the loss of purchasing power. In this scenario, growth would fall further, to +0.4% in 2026 and +0.6% in 2027.
Aggregate growth of emerging markets slows, with differentiated impacts
Growth in emerging economies in 2026 slows to +3.8% in scenario B and +3.4% in scenario C. The deterioration reflects the deterioration in external conditions, which becomes more pronounced the longer the conflict lasts, with widespread but heterogeneous effects among the emerging economies: hydrocarbon exporters (e.g. Russia and Nigeria) could benefit from higher prices, but the positive contribution would remain insufficient to offset the slowdown of large importers, primarily China and India.
In particular, there are three main transmission channels for emerging economies: the first is the worsening terms of trade for oil and gas importers, with an increase in the energy bill; the second is imported inflation, through energy, freight and insurance; the third is the financial channel, with an increase in the risk premium and a possible drop in investments. The prolonged blockade of the Strait of Hormuz could also make trade more difficult, with probable effects for all emerging countries with a greater vocation for trade (China, India, ASEAN countries).
In the scenario comparison, the picture worsens in scenario C, but to an extent less than proportional to the duration of the shock. The adaptation of economies, including diversification of supplies and reorganisation of trade chains, would help to partially mitigate the effects of the protracted war over time. However, uncertainty remains high, also related to possible geopolitical developments and conflict intensity, including regime changes or substantial damage to extractive infrastructure, which are not incorporated in the scenario assumptions and which could make some of the ongoing changes more persistent, if not structural.
World Trade
In the two alternative scenarios, which worsen the international economic picture and are characterised by a longer duration of the conflict, world trade slows down markedly in 2026: it declines by about one percentage point in scenario B (4-month duration) relative to baseline growth, to zero growth in scenario C (end of the war in December). Even in the following year, global trade growth in both scenarios remains below baseline, standing at +2.0% in scenario B and +1.0% in scenario C.
Some factors contribute to the different growth dynamics of world trade immediately, while others contribute more gradually. In particular, the sharp reduction in trade in fuels and lubricants, due to the blockade of the Strait of Hormuz, has an immediate impact on the drop in volumes traded, considering that these commodities represent a significant share of world exports (12.4%). A progressive negative impact stems from higher transportation costs (which is a barrier to trade) and higher levels of uncertainty, both directly proportional to the duration of the conflict. In particular, an increase in uncertainty of 10%, according to CSC estimates, is likely to reduce world trade by about 0.5% in the following quarter.
Risultati per the Italy of CSC simulations
According to simulations using the CSC econometric model, the Italian economy would be significantly affected by the longer duration of the war (Table D).
In Scenario B, Italy's GDP in 2026 would stand still compared to 2025, with a loss of about 0.5 percentage points compared to the baseline, causing the Italian economy to stagnate. In 2027 growth would remain very modest (+0.1%), well below that projected in the baseline scenario. The deterioration of the scenario would be transmitted to the main components of domestic and foreign demand. In particular, in 2026 compared to the baseline there would be a more uncertain trend in consumption, which would slow down with respect to the baseline profile; a weakening of investments, whose growth would drop significantly (about -0.1% versus 2.3% in the baseline scenario); above all, a sharp deterioration of exports, which would go from a growth of over 0.6% in the baseline scenario to a contraction of about -0.7%; negative effects also on the labour market, with employment practically at a standstill.
In scenario C, the impact of the war would be much more pronounced. Italy's GDP would shrink by 0.7% in 2026, with a loss of more than 1.3 percentage points with respect to the baseline scenario. In 2027, growth would remain marginally negative (-0.1%), effectively prolonging the recessionary phase. The worsening would affect all the main demand components in a widespread manner: investments would contract (-0.8% in 2026); consumption would show a negative dynamic; exports would suffer a strong retreat (-1.6% in 2026); and employment would be affected by the slowdown in economic activity.
Applying energy commodity price increases to the production cost structure of Italian firms in the last period before the succession of recent global shocks (pandemic, energy shock and inflation, geopolitical tensions), and taking into account the direct and indirect transmission channels of energy shocks, in 2025 manufacturing still paid a higher energy bill than its European competitors, with energy costs as a percentage of total costs 25% higher than 6 years ago. With the new energy shock resulting from the current conflict, in scenario B, Italian manufacturing companies would find themselves paying an additional EUR 7 billion per year more in energy bills than last year, with energy costs as a percentage point higher as a percentage of total costs, rising from 4.9% in 2025 to 5.9% in 2026. In the worst case scenario (C), companies would pay 21 billion more and the incidence would rise by 2.7 percentage points (from 4.9% to 7.6%).
Related


Join the largest business community in Italy.
Highlighted topics
Our Platform