Share on
Centro Studi Confindustria (CSC) and TeamSystem (TS)
The Real Time Turnover Index (RTT) is an indicator that tracks the dynamics of the volume of economic activity in Italy, based on electronic invoicing data from companies. It was conceived and developed in cooperation by TeamSystem and Centro Studi Confindustria.
Description of data collected by TeamSystem
The data for the construction of the RTT Index are derived from the invoices issued by TeamSystem's corporate customers ('active' invoices). This is a sample of 'corporations', amounting to approximately 200,000 companies (compared to just over 1 million corporations in Italy), divided into small, medium and large, present throughout the country and active in all sectors of the economy.
In addition to this 'open' sample, i.e. including all companies issuing invoices via the TeamSystem platform, processing is also carried out on a 'closed' sample. This sample was used to carry out a series of data checks, described in the following section. It is a sub-sample of approximately 120,000 enterprises, selecting those that are always present throughout the 2020-2023 period, i.e. the most 'loyal' customer enterprises (enterprises with invoices recorded in the RTT database in all months of the 20-23 period), in order to ensure greater homogeneity of the sample over time. The results for the RTT Index obtained on the two different samples are similar, not identical; only the data calculated on the 'open' sample is presented in the monthly release, which is judged to be more suitable to take into account the continuous changes taking place in the economy.
Turnover is the broadest measure of a company's business performance (the first line of the 'profit and loss account' in the balance sheet), so the database is very informative. The TeamSystem data on turnover make it possible to measure the dynamics taking place in the entire economy and its specific subsets. In fact, turnover by definition correlates well with GDP (the difference between turnover and value added consists solely of the costs of purchasing intermediate inputs).
Electronic invoicing, from which the TeamSystem data originate, became mandatory in Italy in January 2019. Monthly turnover data start in January 2020 and are constantly being updated (those available for 2019 correspond to the start-up phase of electronic invoicing, so they were deemed incomplete and unreliable). Invoices are issued by a company for sales to other companies, to the PA, and also to consumers only in cases where an invoice is issued. Invoices refer to sales by companies operating in Italy, both domestically and abroad (excluding purchases from abroad).
Enterprises must issue the e-invoice within 12 days after receipt of payment (and by the 15th of the following month for deferred and summary invoices). For this reason, the turnover realised in a certain month is exhaustively accounted for in the TeamSystem database within the first 15 days of the following month. Extractions earlier than the 15th of the month could lead to 'partial' data.
Checks on TeamSystem data
In order to correctly allocate the value of the invoices issued by the companies for the estimation of turnover, the issuing of credit notes by the companies was also taken into account, referring to the payment of an erroneous invoice by the customer, which requires a refund of part or all of the amount paid and therefore enters with a negative sign. By issuing the credit note, it is possible to initiate the reversal, in part or in full, of the incorrect invoice.
Due to the technical impossibility (at least at the moment) of establishing a precise temporal link between credit note and invoice to be corrected, credit notes are charged to the month of issue (t), and not to the month of reversal (t-1). This may lead to distortions in the data but avoids revisions of the data in t-1 already reported, i.e. the database extraction for previously estimated months is not changed.
In addition, the situation rarely arises where a company makes mistakes precisely in a credit note, i.e. when correcting a previous invoice. In such cases, the company issues a debit note (Document Type TD05), which corrects the credit note (TD04). Therefore, it was deemed appropriate to include in the dataset also debit notes and with the sign reversed with respect to the corresponding credit note.
Debit notes are also charged to the month of issue and not to the month of the correct credit note.
For the correct definition of the sample for RTT, with respect to the invoices in the TeamSystem database, only invoices actually corresponding to the sale of goods and services produced by the companies were taken into account (e.g. self-invoices are excluded).
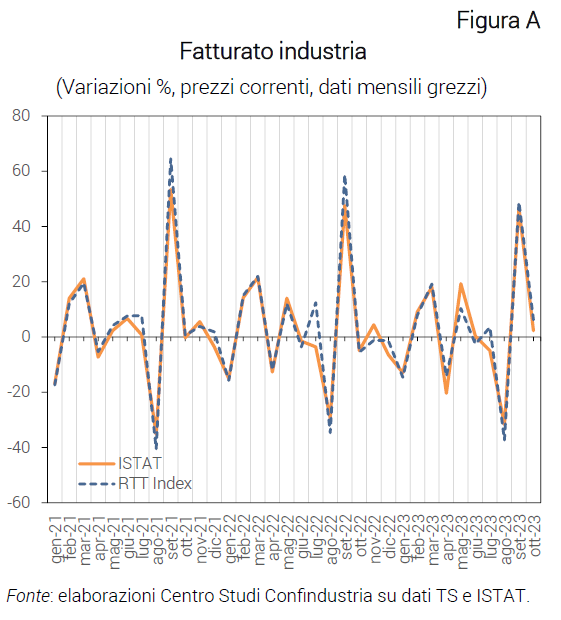
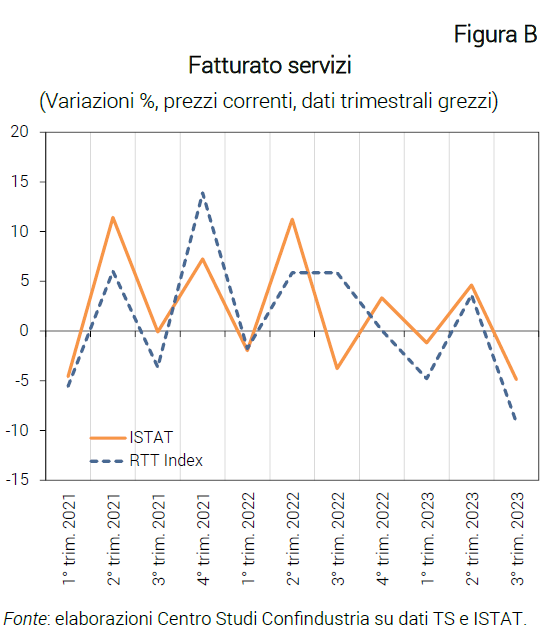
Before the inclusion of credit and debit notes in the dataset, there was a significant accumulation in the TS data of a higher level of turnover than in the ISTAT data. This phenomenon is clearly mitigated in the current version of the dataset: for the remaining share, it is attributable to a detected 'self-selection' on the part of TeamSystem companies. In fact, a comparison with ISTAT data shows that TS client companies have an average turnover dynamic that is higher than the market, particularly in certain months of the year. However, this does not affect the accuracy in general of the cyclical percentage changes of the TeamSystem series which are, in all months, very close to those of the ISTAT series and very precise in terms of sign (see Figure A and Figure B).
In analysing this phenomenon, other types of checks were also carried out. First, on the flow of invoices, evaluating whether to consider only those directed to the SDI (Agenzia delle Entrate); as no appreciable difference in dynamics was found, invoices not passing through the SDI were also kept in the dataset. Second, a check was made with regard to deferred invoices, verifying whether their presence in the dataset could be responsible for some peaks in the time series: the results of the check excluded this possibility and therefore deferred invoices were also included in the dataset.
Moreover, making a comparison with annual turnover data from financial statements (from InfoCamere) and considering the degree of 'coverage' achieved by the TeamSystem data, measured on a sub-sample (approximately 10,000 companies), i.e. the ratio between the sum of annual TeamSystem e-invoices and the official annual turnover of companies (in 2021 and 2022), no significant deviations are revealed. Therefore, the 'coverage' of TeamSystem for the sub-sample considered is almost full (for a large share of the companies, the ratio value is 99% for 2021 and 100% for 2022).
Representativeness of the TS enterprise sample
The TeamSystem sample is very representative of the universe of companies in Italy. This is crucial for the usefulness of any indicator constructed from this database.
The TeamSystem sample was checked for representativeness by territory of location (20 regions), by company size (6 turnover classes), by sector of activity (96 2-digit Ateco codes).
The percentage composition in the TS sample (calculated on the number of enterprises) was compared with that of the ISTAT data for the universe, for all 3 of these sample 'sizes'. The deviations of the percentage shares in the sample, compared to those of the universe, are very small in the 3 breakdowns, particularly in that by region.
For the 20 regions, the "distance" index between the two distributions (calculated as the square root of the sum of the squared deviations, divided by the mean) is 1.3, which is very low ("borderline" values of the indicator: equal shares of the universe, distance index 0.0; all shares equal, distance index 4.6; one share equal to 100 and the others equal to zero, distance index 16.5/21.0).
For the 72 sectors on which it is possible to make the comparison (using the same 'breadth' as the breakdown by regions), this distance index is 2.9, higher than that calculated for the territories, but still rather small ('borderline' values: percentage shares equal to the universe = 0.0, all shares equal = 4.3 and one share equal to 100 and the others equal to zero = 17.7/20.6).
The CSC's construction of the indicator
The turnover of a territory, of a sector, of a size class, in a certain month, is given by the aggregation of the individual invoices corresponding to that 'size' included in the database. The turnover of the total economy is equal to the sum of the turnovers of the individual 'dimensions'.
To obtain the RTT Index, a series of data 'correction' operations were conducted, which will be repeated by the CSC every month, sequentially and in a specific order.
The calculations are carried out by the CSC not on individual invoices or individual companies (micro-data), which are not available for confidentiality reasons, but on monthly aggregates of invoices, corresponding to each of the 'region/sector/size' crossings.
To this end, TeamSystem elaborates a database covering 20 regions, 96 economic sectors (Ateco 2 digits), 6 turnover size classes (i.e. < €100,000, etc.), which it supplies to the CSC every month. The breakdown by turnover class, as a proxy for enterprise size, overlaps with the official European classification of turnover classes.
The data are processed by the CSC at a higher level of aggregation than that theoretically available in the database (4 macro-areas, 4 macro-sectors, 3 size classes; without cross-referencing the 3 dimensions for the time being), in order to obtain 11 detailed indicators plus the total economy, for an overall total of 12 indicators. This choice is dictated by statistical "prudence": very detailed data, in fact, may be weakened by a low number of enterprises/invoices in the specific territory-sector-dimension "crossover".
Below, the six steps of the corrections carried out by the CSC are described:
First phase (at the end of this phase, we obtain the 'raw' data shown in Figures A and B):
1. Elimination of outliers: Outliers are sought on each of the 3 available dimensions (region / sector / class) as an "excessive" and not credible value; they are identified by defining a range for the monthly percentage share of a region (sector, dimension) in the total, equal to 4 standard deviations above and below its average, such that data with a percentage share larger or lower than this range are defined as "outliers" (resulting in 9 outliers in the entire dataset between 2020 and 2023). These outliers are then replaced by an estimated figure, the level of which is based on the percentage changes over the previous 12 months. A limitation of this step is the risk of eliminating a figure that is not really an error, but which could be due to the unusual concentration (or rarefaction) of sales in one month; given the magnitude of the percentage changes involved in all the cases detected, the probability that these are not mere errors seems very small.
2. Calculation of the "average" turnover: Each month, the turnover figure is divided by the number of enterprises (average turnover = turnover / no. of enterprises), in order to take into account any abrupt monthly changes in the sample size, thus preventing the new monthly turnover figure from being distorted downwards, for example, by a sudden drop in the number of enterprises in the TS database.
3. Carry-over to the universe: monthly correction coefficients, calculated on the basis of the number of companies actually present in the sample month by month, in a given sector, region, size, with respect to the universe (coefficients defined as a ratio: "TS share / ISTAT share"); this correction is necessary to avoid giving undue weight to the trend of a sector, a region, a size class.
Second phase:
4. Correction for days worked: similarly to what ISTAT does for industry turnover, in addition to the "raw" data, we calculate data corrected for calendar effects (non-holiday days of the month, Easter, leap year), for the total RTT Index and for the 2 main macro-sectors (industry, services); we apply the 'regression' method (as ISTAT); a limitation of this step is in the short length of the available time series (about 4 years), a problem that is mitigated by back-propolation for the years before 2020 based on ISTAT data (only for total and the 2 macro-sectors).
5. Deseasonalisation: turnover shows a significant seasonality (minimum in August each year, peak in December, etc.), which must be eliminated for a correct reading of the monthly dynamics.), which must be eliminated for a correct reading of the monthly dynamics; we apply the statistical procedure used by ISTAT for industry turnover (Tramo-Seats)6; as for calendar effects, the problem of the short length of the available time series is mitigated by back-propolation; one limitation is that the procedure (by Ateco macro-sectors, instead of by industry groupings) and the parameters used are different from those used by ISTAT.
6. Deflation: the data collected by TeamSystem are at current prices, so it is necessary to purify them from price dynamics in order to try to measure volume turnover trends. The ideal price indicator is producer prices. A limitation of this step is the incomplete availability of ISTAT sectoral and territorial and dimensional data on producer prices (in particular, the quarterly value added deflator is used for the services and agriculture sectors). In addition, the delay in the release of ISTAT data on producer prices compared to the faster availability of electronic invoice data makes it necessary to 'assume-predict' (on the basis of available historical data) the last month of data in order to realise deflation.
At the end of these 6 steps, the final RTT Index is obtained, commented on in the monthly press release, in terms of monthly percentage changes.
In order to obtain a smoother series, showing the trend of the last few months, a three-month moving average is then calculated, shown in the graphs of the release, to facilitate the identification of the underlying trend, beyond the volatility of individual months.
The monthly RTT Index on turnover
The RTT Index consists of monthly data on average turnover for the total Italian economy, seasonally adjusted and in volume. It is a real economy variable (hard data), measured from invoices actually issued in Italy and not estimated.
Three types of breakdown of this data are available, giving a total of 11 detailed indices:
I. Territory of location, for 4 macro-areas (i.e. North-West, North-East, Centre, South-Islands);
II. Sector of activity, for 4 macro-sectors (i.e. agriculture, industry, construction, services);
III. Enterprise size, for 3 classes (i.e. small, medium, large).
Comparison with existing official data
There is no monthly ISTAT turnover data for the total economy (total economy turnover is only available in annual data, with a considerable delay). RTT Index therefore fills this gap in the official data, making real-time data available.
ISTAT calculates turnover, monthly, at current prices, only for industry; ISTAT volume turnover is only available for manufacturing (not for total industry); ISTAT industrial turnover is calculated on a sample of 8,000 enterprises, far fewer than those in the TS database.
For the construction sector, ISTAT calculates production monthly, not turnover. For the service sector, ISTAT calculates quarterly turnover, not monthly. For agriculture, the most frequent ISTAT figure is quarterly value added (a supply-side component of GDP).
For the territories, ISTAT data are made available with a significant time lag: in this respect, the improvement achieved with RTT Index is definitely large.
Thus, not only more up-to-date data become available, but also turnover information for sectors and territories that previously did not exist at all.
Reliability of the RTT Index
The RTT Index follows very closely the historical, monthly turnover data published by ISTAT. This check was made, first of all for the industry sector and for the services sector, on the 'raw' RTT Index data (only corrections 1,2,3) and ISTAT, and is represented in Figures A and B. Where the monthly cyclical changes for industry turnover and the quarterly changes for services turnover (not seasonally adjusted and in current prices) are shown. A remarkable alignment between the RTT Index and ISTAT series clearly emerges: the correlation index over the period 2021-2023 is 98% for industry and 49% for services.
The RTT Index also shows a good fit with the ISTAT data on construction production: the correlation between the RTT Index in its deflated version (steps 1,2,3,6) and the ISTAT construction production is 60% over the period 2021-2023, in terms of monthly percentage change (deflated, not seasonally adjusted data).
It thus turns out that the short-term dynamics of the RTT Index are very close to those measured by ISTAT in the various sectors of the economy. This makes the RTT Index very credible as an indicator and thus useful for studying the economy.
Timeliness of the RTT Index
The RTT Index allows an almost 'real time' analysis of economic trends. Between the 15th and 20th of a given month, the complete data for the previous month is available, significantly in advance of the ISTAT data.
For example, the RTT Index data for October are available on 15-20 November, while the ISTAT data on turnover (in industry), published on 29 November, stop at September.
So, with the new indicator it is possible to anticipate the release of official data for industry by more than 1 month. Much more for the other sectors, especially services and agriculture (for which ISTAT data are quarterly).
In each month, RTT Index is one of the first hard data available for Italy. PMI is available a few days earlier, but it represents 'soft', qualitative information, i.e. it returns a perceived figure that comes from responses to a business survey. Ita-Coin is also available a few days earlier, but is an estimated figure (not measured as RTT Index), with econometric procedures based on various sources, including qualitative surveys.
No additional statistical burden for companies
A distinct advantage of RTT Index over qualitative economic data is that it does not require any additional statistical burden on companies, as the data is automatically derived from the invoices they issue for their normal business operations.
Any data deriving from a survey, on the other hand, e.g. the one on the basis of which ISTAT calculates industry turnover or the one underlying the construction of the PMI index, results in a statistical burden falling on the enterprises that have to answer a questionnaire (with all the problems related to possible non-responses, total or partial, on the part of the enterprises). For RTT Index, only statistical processing is required from TS and CSC.
Dissemination of the RTT Index
Starting in January 2024, a joint CSC and TeamSystem press release will be issued, monthly, around 20-25 of the month, to publish and comment on the turnover data in the previous month (e.g.: on 20 January 2024, data for December 2023 are released).
The communiqué will report monthly aggregate data for Italy and the historical series from January 2021, a graph with the detail for macro-sectors, a graph with the latest data for macro-areas and size classes (in all, 12 new data per month).
RTT 2.0 (aggiornamento di maggio 2026)
All’inizio del 2026, TeamSystem (TS) e Centro Studi Confindustria (CSC) hanno deciso di realizzare una revisione dell’indicatore RTT, dopo i primi 2 anni della sua realizzazione (il primo Comunicato è stato pubblicato a gennaio 2024). Questo aggiornamento è stato ritenuto utile a seguito dei vari feedback raccolti insieme, progressivamente, durante il primo periodo di elaborazioni per la costruzione di RTT. Tale processo ha richiesto alcuni mesi di lavori, a chiusura dei quali si è tornati alla pubblicazione del Comunicato mensile di RTT da maggio 2026 (l’ultimo era stato diffuso a novembre 2025).
1. Nuovo database costruito da TS
La modifica principale è stata realizzata alla fonte, cioè nella costruzione del database da parte di TS, sulla base delle fatture elettroniche raccolte presso le imprese clienti. In particolare, sono stati migliorati gli algoritmi di costruzione del database ed è cambiato il provider esterno dell’anagrafica delle imprese. Una novità è che le classi dimensionali sono scese a 5, rispetto alle 6 precedenti che, comunque, venivano e vengono aggregate in 3 classi nelle elaborazioni finali.
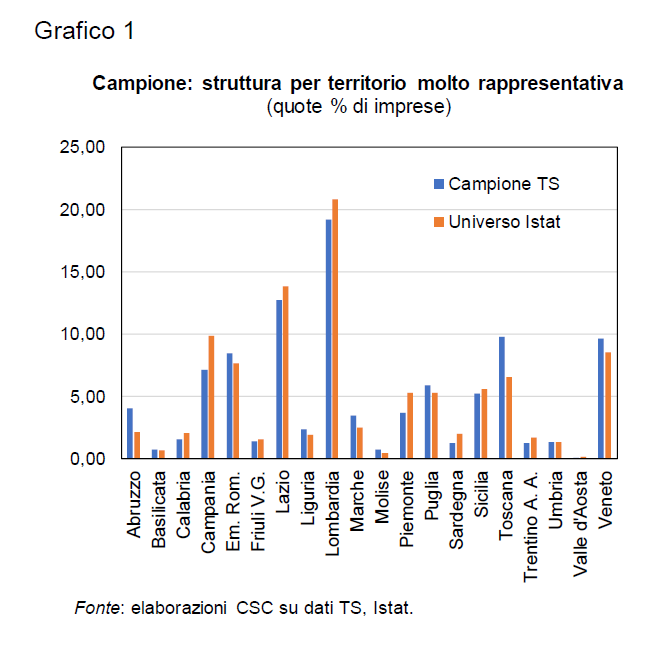
Il “nuovo” campione di imprese risulta, come quello precedente, avere un ottimo grado di accostamento all’universo Istat, in termini di numero di imprese per regione e per settore. Anzi, si registra un lieve miglioramento della sua rappresentatività: l’indice di dispersione degli scarti del campione dall’universo, calcolati per regioni, si è ridotto da 1,3 a 1,1 (Grafico 1: Rappresentatività del campione TS per regioni).
Nel passaggio al nuovo database, sono emerse alcuni punti di attenzione minori, che non inficiano la bontà complessiva del campione. Il primo è che risultano non disponibili alcuni dati di fatturato per l’agricoltura, nelle grandi imprese, nella maggior parte delle regioni; ciò a causa delle regole per la privacy, che sono rispettate da TS nella costruzione del campione. Il secondo è che per le dimensioni di impresa, risultano molti i casi di dati “Not Available” (il 15% del totale), cioè dati di fatturato che non è possibile attribuire a nessuna delle 5 classi dimensionali. Per entrambe, è stata trovata una soluzione operativa, descritta ai successivi punti di questa Nota.
I dati vengono forniti da TS al CSC il 20 di ogni mese, come prima, con la stessa aggregazione per aree, settori, dimensioni, mentre continuano a non essere forniti i microdati sottostanti. Il numero di imprese nel campione è pari a circa 200mila (solo società di capitali), in media, nelle estrazioni relative ai vari mesi del 2025, rispetto a circa 180mila in media nel vecchio campione. Il numero di fatture incluse nel database è pari a circa 8 milioni al mese in media. Il valore complessivo del fatturato è pari a circa 27 miliardi medi al mese, 324 miliardi annui (pari a 8% del fatturato del totale economia). La serie storica di tale database di fatturato è ricostruita da marzo 2020 ad aprile 2026.
2. Procedura rivista di correzione dei dati grezzi, a cura del CSC
La procedura in 6 step seguita per calcolare RTT nei primi 2 anni resta sostanzialmente invariata, ma con alcune importanti novità e viene applicata al database nuovo di fatturati. La sequenza originaria degli step era questa: eliminazione outlier, calcolo fatturato medio, riporto all’universo; correzione per i giorni lavorati, destagionalizzazione, deflazione.
In RTT 2.0, invece, a conclusione di un processo di model evaluation, è stata scelta la combinazione e l’ordine degli step che consente di massimizzare l’accuratezza di segno nei 3 macrosettori principali (industria, costruzioni, servizi). La nuova sequenza di step è quindi: deflazione, destagionalizzazione – outlier – giorni lavorati, riporto all’universo, fatturato medio. Qui di seguito, si descrivono altre innovazioni incorporate in RTT 2.0.
Il riporto all’universo, visti i dati Istat disponibili e per evitare di creare uno “scalino” tra dicembre e gennaio di ogni anno, è realizzato sui livelli, con dati annuali (non mensili) e sull’intera serie storica (non anno per anno). Inoltre, tale step è stato spostato verso la fine della sequenza, come step 5.
Per la deflazione, oltre ai PPI mensili per industria e costruzione, si usano ora i PPS per i servizi (invece dei deflatori, comunque trimestrali), tutti dati di fonte Istat.
Per il problema del dato mancante nei PPI nell’ultimo mese (perché non ancora pubblicato da Istat), cioè per il mese di riferimento di RTT, vengono ora utilizzate le attese sui prezzi delle imprese come leading indicator: dalle stime risulta che, nella relazione da attese a PPI, ci sono dei significativi lag in tutti i settori, che consentono di ottenere una stima per l’ultimo mese dei PPI/PPS.
Gli outlier nel database sono meno evidenti adesso, perché sono migliorate le verifiche implementate da TS sui dati alla fonte. Quindi, lo step per l’eliminazione degli outlier nel database ora è meno rilevante, ma è stato deciso di tenerlo nella procedura statistica per completezza e affidabilità dei dati (viene realizzato unitamente alla destagionalizzazione e alla correzione per i giorni lavorati).
Per la destagionalizzazione, dopo alcune verifiche, si è deciso di continuare ad utilizzare il metodo Tramo-Seats, che consente di ottenere una maggiore accuratezza di segno rispetto ai dati Istat.
Alcune operazioni statistiche, necessarie per alcuni degli step, vengono ora realizzate su software più efficienti e in modo più automatizzato.
Si è reso necessario aggiungere all’inizio uno “Step 0”, per imputare i dati non disponibili (agricoltura-grandi imprese) in base ai dati parziali sul settore agricoltura comunque presenti nel database.
Si aggiunge, alla fine delle procedure, uno Step 7, con l’obiettivo di ridurre l’ampiezza del campo di variazione di RTT 2.0 e renderlo più direttamente confrontabile con i dati Istat di più immediato riferimento, cioè le variazioni % mensili del fatturato. Questo nuovo step consiste nel moltiplicare i dati risultanti dai 6 step per un fattore ≤ 1, un “Beta”, che è stimato in 3 regressioni, di tipo single equation, tra il dato Istat e l’indice RTT per ciascun macrosettore (industria, servizi, costruzioni, esclusa l’agricoltura). La media di tali 3 parametri stimati, ponderata con le corrispondenti quote settoriali Istat a livello nazionale, è usata poi come Beta per RTT totale.
3. Risultati per il nuovo “RTT 2.0”
CSC e TS riprendono la pubblicazione del Comunicato stampa mensile di RTT, col quale avviene la diffusione dei dati con lo stesso grado di dettaglio fornito nei primi due anni: totale economia e per 4 macroaree, 4 macrosettori, 3 classi dimensionali (12 indicatori complessivi).
La disaggregazione di RTT 2.0 per dimensioni di impresa è ora calcolata su un campione di poco ridotto in termini di numero di imprese, per ovviare al problema dei dati “NA” presenti nel database.
Il comunicato è pubblicato alla fine di ogni mese, con i dati relativi al mese precedente, come prima. Rimane quindi invariato il principale punto di forza di RTT, che è la sua tempestività nella diffusione dei dati (solo 25 giorni circa di ritardo sul mese di riferimento dei dati).
Nel comunicato mensile, per il totale economia, vengono pubblicati i dati di RTT corretti per il relativo β, cioè “normalizzati” grazie al nuovo “step 7”.
La gran parte delle osservazioni di RTT 2.0 per il totale economia, corretto per il Beta, risulta compresa nell’intervallo tra -2,5% e +2,5% nel periodo 2021-2026. Un campo di variazione più simile a quello del PIL (tra -0,2 e +2,5% tra il 2021 e il 2025), rispetto a quanto avveniva con il primo RTT.
L’RTT industria si muove tra -5,8%/+5,0%, un campo di variazione di ampiezza simile a quello del fatturato industriale Istat, che è un dato volatile (tra -5,3% e +4,3% tra 2021 e 2026).
La volatilità di RTT 2.0, calcolata come standard deviation, per l’industria risulta pari a 2,1 sul periodo 2021-2025, più contenuta rispetto al valore di 3,5 osservato per il precedente RTT; anche per RTT nei servizi la volatilità si è ridotta (1,9 da 4,8).
RTT 2.0 risulta piuttosto vicino, nei dati storici, alla dinamica dei corrispondenti dati ufficiali diffusi da Istat. In particolare, la “accuratezza di segno”, cioè la quota di mesi in cui la var. % di RTT va nella stessa direzione del dato Istat è pari a 55% per l’industria, 50% per le costruzioni, 57% per i servizi, valori molto vicini a quelli che caratterizzavano il vecchio RTT.
La correlazione tra RTT 2.0 per l’industria e il fatturato dell’industria Istat (prezzi costanti, dati destagionalizzati, corretti) è pari a 0,35 nel periodo 2023-2026; quella tra RTT per le costruzioni e la produzione del settore è di poco superiore (0,53 tra 2021 e 2026), mentre quella con il fatturato nei servizi è la maggiore (0,88 tra 2021 e 2026).
Related


Join the largest business community in Italy.
Highlighted topics
Our Platform