Giovanna Labartino
John Morleo
Share on
Giovanna Labartino, Francesca Mazzolari and Giovanni Morleo
- The annual Confindustria Labour Survey, carried out between February and April 2025, provides information for 2024 and early 2025 on the structure of employment and corporate labour management policies in member companies. A this link summary and comparative tables on the main variables under investigation are available.
- Particular attention, in this year's survey, is paid to three areas: companies' difficulties in finding skills and the actions put in place to deal with them; the disbursement of collective variable bonuses and corporate welfare initiatives; and the spread of agile work, surveyed in terms of adoption and intensity of use. The 2025 edition also introduces a new focus dedicated to the adoption of artificial intelligence in member companies, with an in-depth analysis of application areas, actions in the human resources field and the main criticalities encountered.
- Among the companies with ongoing personnel searches at the time of the survey, 67.8% stated that they were experiencing recruitment difficulties, a figure in line with that found in the previous edition. Problems emerge above all for technical skills (indicated by 57.1% of companies with difficulties) and manual tasks (46.3%), with higher incidences in industry than in services. Less widespread, but still significant, are the difficulties in finding transversal skills (18.5%) and advanced digital skills (18.4%), especially in services.
- The majority of companies with staffing difficulties have implemented countermeasures (84.1%), focusing primarily on training internal staff (56.0%). External collaborations (52.9%) and the expansion of research pools (40.2%) are also widespread. In addition, almost a third of companies have initiated or strengthened forms of collaboration with the territorial education system (ITS Academy, PCTO, curricular traineeships, etc.). Among industrial companies in particular, structured initiatives with secondary schools, higher technical institutes and universities are more widespread, especially in larger companies.
- With reference to agile working, the survey results show that 32.3% of member companies used this working mode in 2024, a share that has almost quadrupled compared to the pre-pandemic period but remains substantially stable compared to the previous year. The intensity of use also remains significant: in companies where agile work is planned, 35.8% of non-management employees used it, predominantly up to 2 days per week.
- The survey continues to monitor the spread of company collective agreements and the main subjects regulated. At the beginning of 2025, 28.1% of member companies applied a company contract, signed with RSU/RSA or territorial representations. The spread is higher in industry in the strict sense (36.2%) than in services (21.4%) and increases with company size: it rises from 14.5% among companies with up to 15 employees to 70.2% among those with at least 100 employees.
- Company bargaining involves an even larger share of employees than company bargaining: 67.8% of employees in the overall sample are employed by companies that apply it, with peaks of 71.7% in industry in the narrow sense.
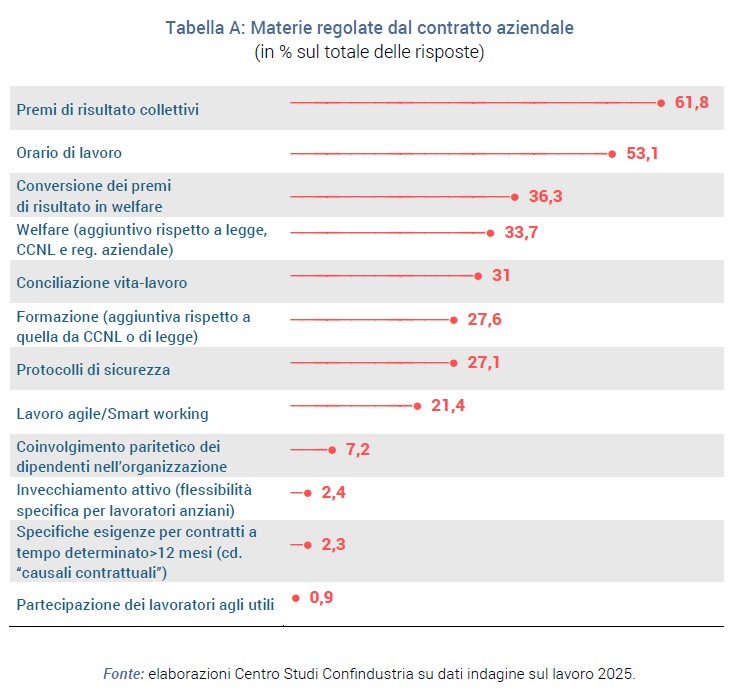
- The main subjects regulated by company contracts remain collective performance bonuses (present in 61.8% of contracts), the possibility of converting them into welfare (36.3%) and working time (53.1%). This is followed by the offer of additional welfare services (33.7%), work-life balance measures (31%) and training activities in addition to compulsory ones (27.6%).
- Among companies that provide for bonuses in company contracts, 59.4% actually paid them out in 2024. In about half of the cases (49.3%) at least one worker chose to convert part of the bonus into welfare: on average, 41.9% of workers opted for conversion, allocating 72.5% of the bonus to welfare instruments.
- Corporate welfare is present in 55.3% of member companies, an increase compared to the previous year. The share includes both companies that provide it by company contractual provision (16.4%) and those that adopt it by unilateral initiative or as a result of other institutions (38.9%, e.g. CCNL). The prevalence is particularly high among industrial and larger enterprises.
- The 2025 survey introduces for the first time an in-depth look at the adoption of artificial intelligence (AI) in member companies. 11.5% say they have already adopted or are experimenting with AI solutions, while a further 37.6% are considering its introduction. Actual use is more widespread in services and larger companies. The most common applications are in data analysis, marketing, research and development, process automation and customer service. However, only 43.7% of the companies that are adopting AI have already taken action on the human resources front, mainly in terms of internal training, use of consultants and, to a lesser extent, recruitment of specialised profiles. The main critical issues encountered are the lack of in-house skills (36.7%), the technical complexity of integration and the still high cost of technology.
1. Employment in Confindustria System companies in 2024
1.1 Employment increased, also in industry
Total salaried employment in Confindustria member companies increased by 2.4% between the end of 2023 and the end of 2024. The increase was largest in services (+4.2%) and construction (+5.2%), but the change was also positive in industry in the narrow sense, both on average (+1.0%) and in the individual sectors considered, with the exception of textiles (Figure A).
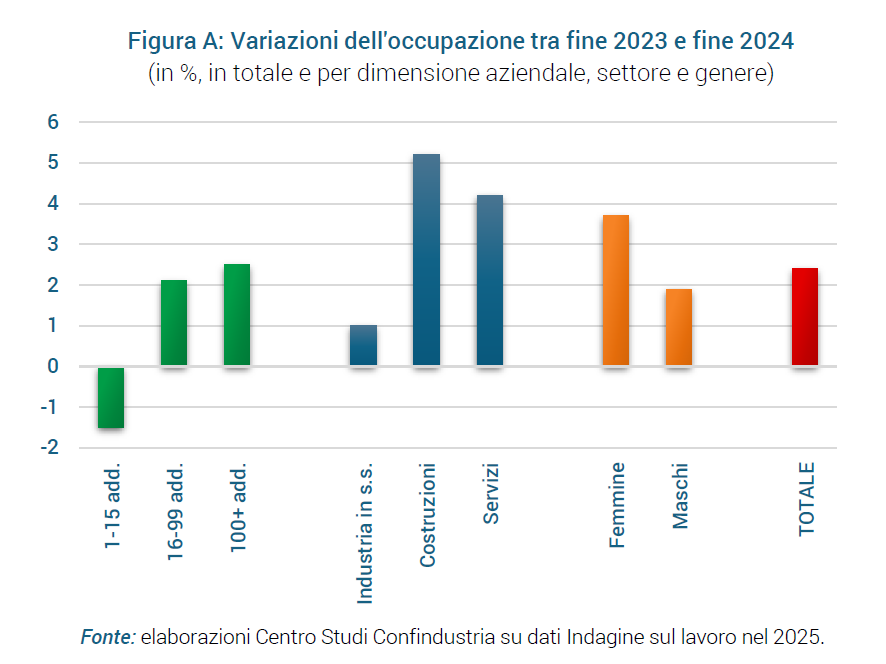
In the Confindustria System, therefore, the picture that emerged with the energy crisis for manufacturing at national level is also confirmed, and is characterised by a phenomenon of 'employment without growth': on the basis of ISTAT data from the National Accounts, in fact, added value fell by 2.7% from the last quarter of 2021 to the last quarter of 2024, and in the same period AWUs increased by 3.2% and the number of persons employed by 3.1%.
The increase in employment in industry recorded by the survey is limited to those with 16 employees or more (-4.6% in the smallest), while in services it involves enterprises of all size classes. With respect to the type of contract, the member companies operating in industry also recorded an increase in permanent employees (+1.61 FTE6T), but a decrease in fixed-term employees (-7.71 FTE6T), which, moreover, represent the employment component that is most reactive to the cycle. In services, on the contrary, both permanent and temporary workers were on the rise.
The growth in employment in industry in the narrow sense is the result of an outgoing turnover (10.5%) that is lower than the incoming turnover (11.4%). When compared to the last survey, both values appear to be decreasing compared to 2023. The fact that in a year of declining production and added value, the outgoing turnover also decreases, not just the incoming one, is consistent with another widely documented phenomenon in the Italian economic system, namely that of widespread and growing difficulties in finding personnel, which could induce companies to hold back workers for fear of not being able to find the appropriate skills when needed.
A comparison of the turnover rate between macro-sectors confirms, however, that it is much higher in services (57.2% in 2024) than in industry in the narrow sense (21.9%), given a higher turnover of both inflows (30.7%) and outflows (26.5%).
1.2 Widespread use of staff leasing contracts
More than one third of the member enterprises (31.1%) employed at least one temporary agency worker (ex-interim) in 2024, with a higher prevalence in industry (40.1%) and large enterprises (76.5% in those with at least 100 employees; Figure B). To give an idea of the intensity of use, consider that the number of temporary agency workers used by the company as a whole in the year averaged 6.1% of the total workforce carried over to 31 December 2024.
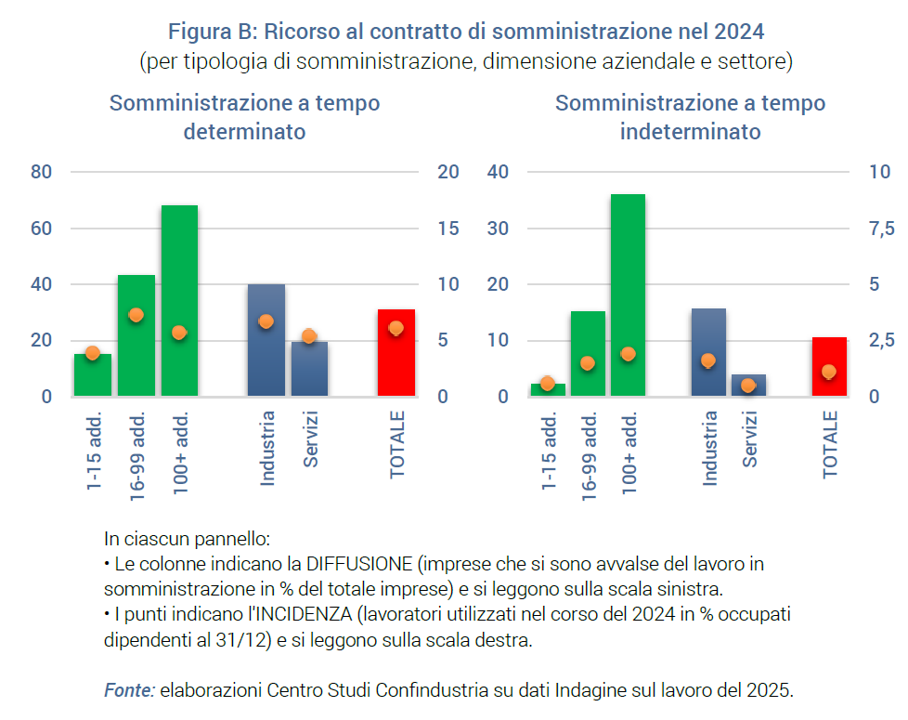
On average, staff leasing was used by one in 10 companies, again more in industry (15.6%) and in large companies (36.0%), for a share of workers hired during the year of 11.1% of the company workforce.
The use of staff leasing, in terms of both the number of companies using it and the number of workers involved, was large and almost stable in 2024 compared to the previous survey for 2023, confirming that it is a form of employment that companies effectively use to select specific resources to be included in the workforce at an early stage.
2. Absences from work in 2024
2.1 Higher absenteeism rates in larger companies
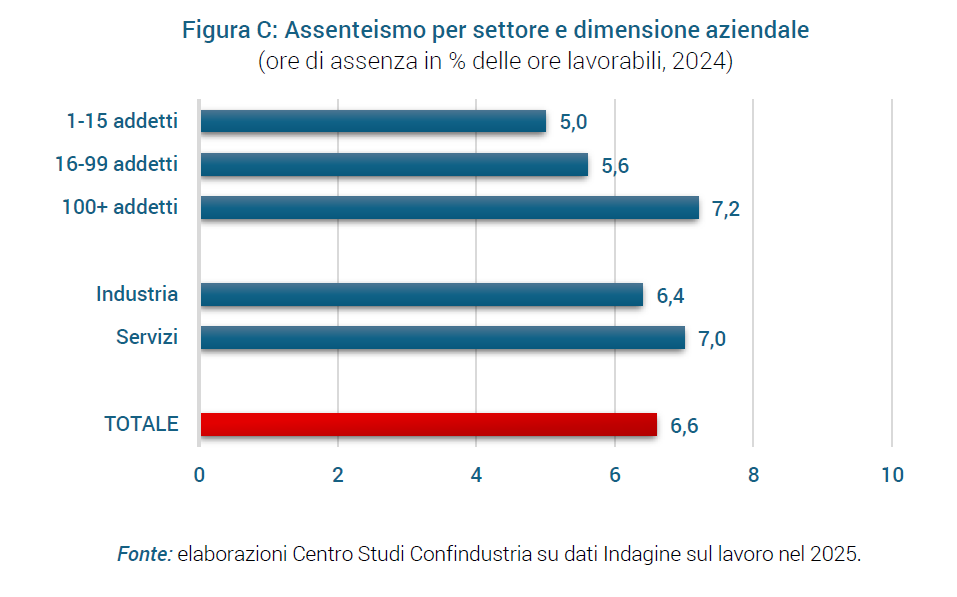
During 2024, the average number of hours worked per capita, net of Wage Guarantee Fund hours, was 1,6902. Of these, 111.9 were not worked due to absences from work (paid and unpaid). The absenteeism rate (calculated as the ratio of hours of absence to hours worked) thus stood at 6.6%.
The incidence of absenteeism, as calculated on the basis of data from the Confindustria labour survey, was higher in services (7.0%) than in industry in the strict sense (6.4%). The absenteeism rate continued to increase as company size increased: 7.2% in those with 100 or more employees, 5.0% in those up to 15 (Figure C).
Non-occupational illness was confirmed as the most frequent cause of absence (3.3% of the average employee's workable hours), followed by paid leave (amounting to 1.0%), while the category of leave for Law 104 and other paid leave accounted for 0.7% and 0.8% of workable hours respectively. The incidence of absences was 5.9% among men and 8.2% among women. Parental leave explained almost all of the difference, accounting for 2.6% of the working hours for women and 0.4% for men.
3. Corporate policies, agile working and human capital
3.1 Company contract present in more than one in four member companies
Based on the results of the latest Confindustria labour survey, in early 2025 28.1% of member companies apply a company contract, i.e., signed with RSU/RSA or territorial representations. The spread is higher in industry in the strict sense (36.2%) than in the service sector (21.4%).
The presence of company contracts varies significantly according to the size of the company: the prevalence is 70.2% in companies with at least 100 employees while it drops to 14.5% in smaller companies (up to 15 employees). Consequently, the percentage of workers covered by a company contract is higher than the share of companies: it exceeds two thirds of the total in the overall sample (67.8%) and reaches 71.7% in industry in the narrow sense.
Among the subjects regulated in company contracts, collective performance bonuses stand out, present in 61.8% of the company contracts of Confindustria member companies. This share rises to 86.8% among companies with at least 100 employees and reaches 91.3% in large companies in industry excluding construction.
Other matters frequently regulated by company agreements are working time (53.11 FTE6T) and the possibility of converting performance bonuses into welfare (36.31 FTE6T). In more than a third of company agreements (33.71 FTE6T), the offer of welfare services (in addition to those provided for in the national collective labour agreement or company regulations) is also regulated. This is followed by work-life balance initiatives (31%) and additional training over and above that compulsory by law or CCNL (27.6%; Table A).
3.2 Collective variable premiums affect blue and white-collar workers more
Among the companies that apply a company agreement that provides for collective variable bonuses, 59.4% claim to have actually paid a bonus in the course of 2024. This share grows with company size: it goes from 51.2% recorded for small companies, to 65.6% for medium-sized companies, to 79.5% for large companies.
In 2024, collective variable premiums averaged 4.41 FTE6T on the total annual remuneration of blue- and white-collar workers and 3.71 FTE6T for executives. In industry, the incidence of premiums was 4.8% for blue and white-collar workers and 3.5% for middle management.
3.3 Welfare initiatives present in more than half of the enterprises
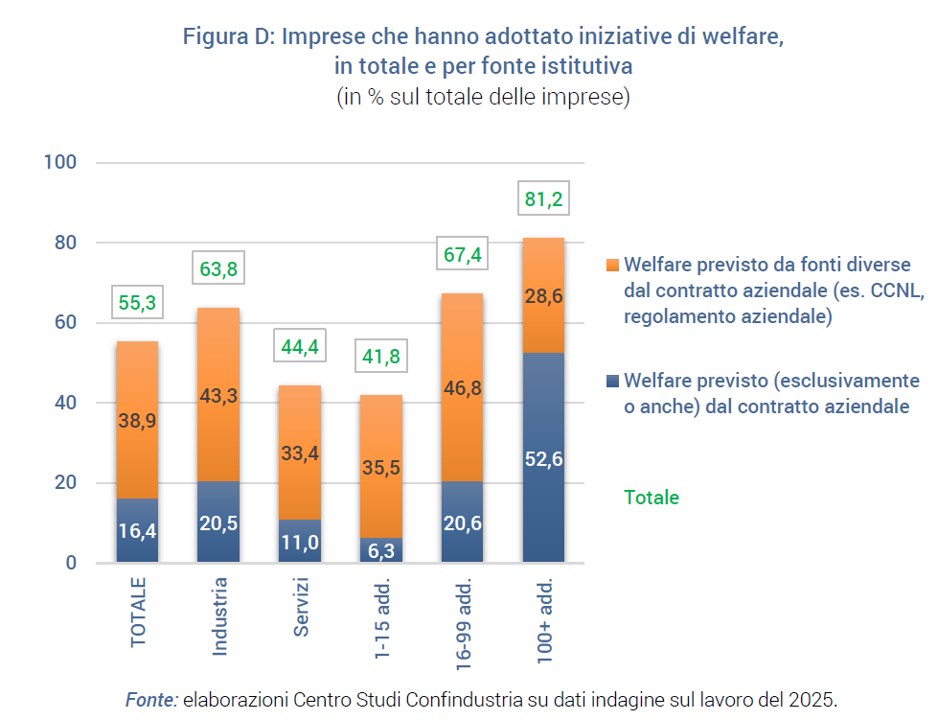
According to the Confindustria survey, more than half (55.3%) of member companies have adopted welfare initiatives for their employees. The spread is greater in the industrial sector (63.8%) than in the services sector (44.4%) and grows with company size, from 41.8% of companies with up to 15 employees, to 67.4% of medium-sized companies, to 81.2% of those with more than 100 employees (a figure that rises to 87.7% for industrial companies).
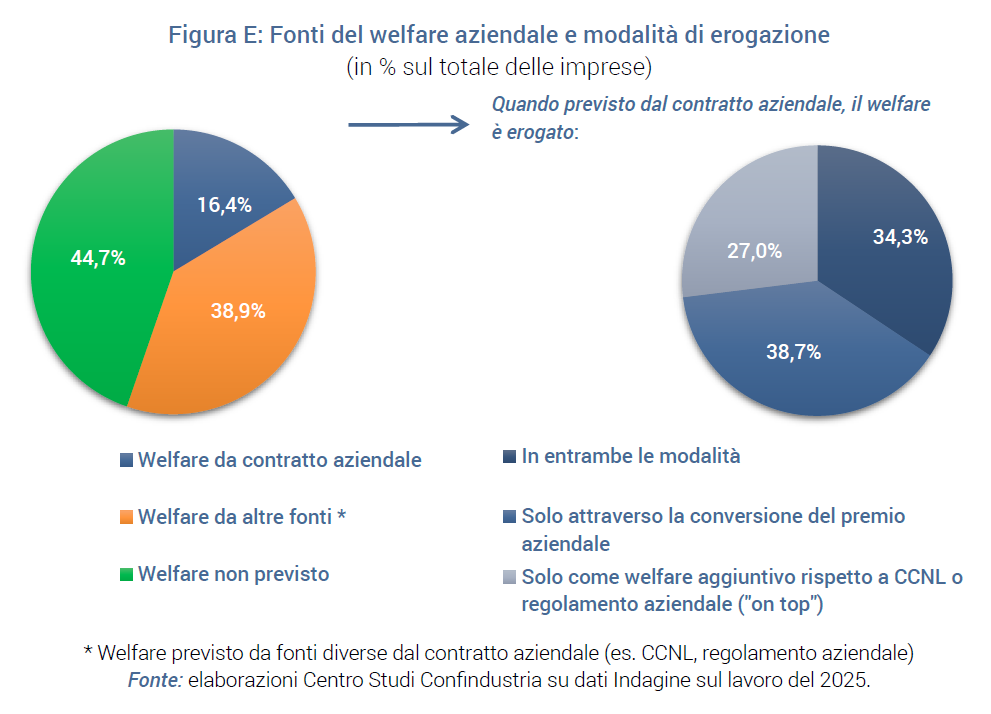
The 55.3% of the companies that provide welfare can be distinguished in relation to the founding source4 , i.e. as the sum of those that provide it (exclusively or also) by company contract (16.4% of the total) and those that instead provide it because it is provided for by sources other than the company contract, for example the CCNL or by unilateral initiative of the employer (the remaining 38.9%). This second group, for which the institutive source of welfare excludes the company contract, is preponderant in small and medium enterprises, while company bargaining is confirmed as the privileged institutive source in large enterprises (Figure D).
With reference to the different ways in which welfare is provided by company bargaining, in 38.7% of the enterprises welfare is exclusively derived from the conversion of a performance bonus, in 27% of the cases welfare is provided exclusively in a manner unrelated to the performance bonus, while in the remaining 34.3% the enterprises provide for both ways (Figure E, right panel).
Among companies that paid collective variable bonuses in 2024, the survey found that in almost half of the cases (49.3%) at least one worker actually converted the bonus into welfare, a situation more common in large companies (59.9%) than in small ones (23%). On average, 41.9% of the workers involved opted for conversion, choosing to convert 72.5% of the bonus received into welfare.
3.4 Agile working in one in three companies, more frequently up to two days a week
This year's survey also surveyed the degree to which agile working (or smart working) was used by member companies in two distinct time periods, namely before the pandemic and in 2024. Companies that have used agile working were also asked about the average intensity of use, in terms of number of employees per days per week (or month) of remote working.
The results indicate that agile working is present in 32.3% of companies, a very similar spread to that estimated by last year's survey. There is therefore evidence of a stabilisation in the adoption of this working mode around one third of companies - a level four times higher than in the pre-pandemic period, when just over 8% of companies used it (Figure F).
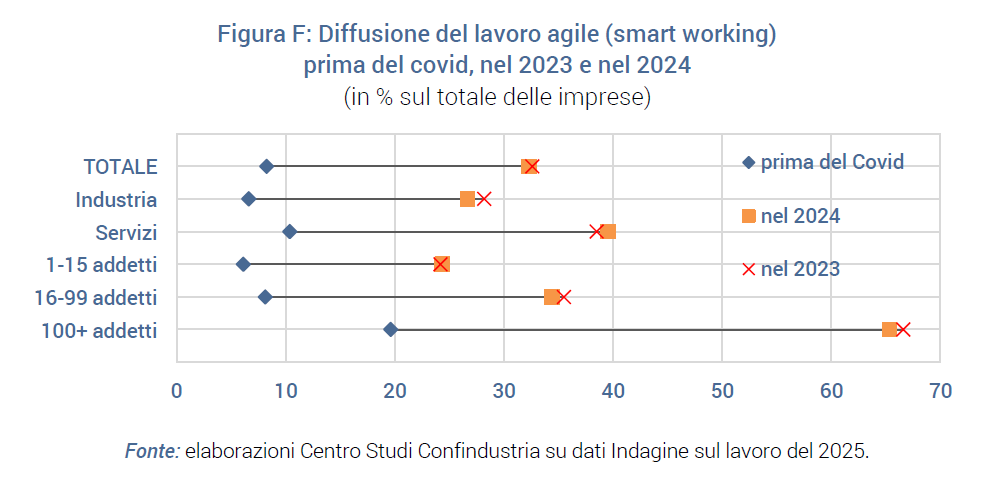
This mode of working is confirmed as being more widespread in service enterprises (39.6%) than in industry (26.7%), partly due to the very nature of the activity. The spread of agile work, moreover, remains closely linked to company size, being present in less than a quarter of small companies, with fewer than 15 employees (24.3%), in about a third of medium-sized companies, between 16 and 99 employees (34.4%), and in almost two thirds of large companies, with more than 100 employees (65.4%).
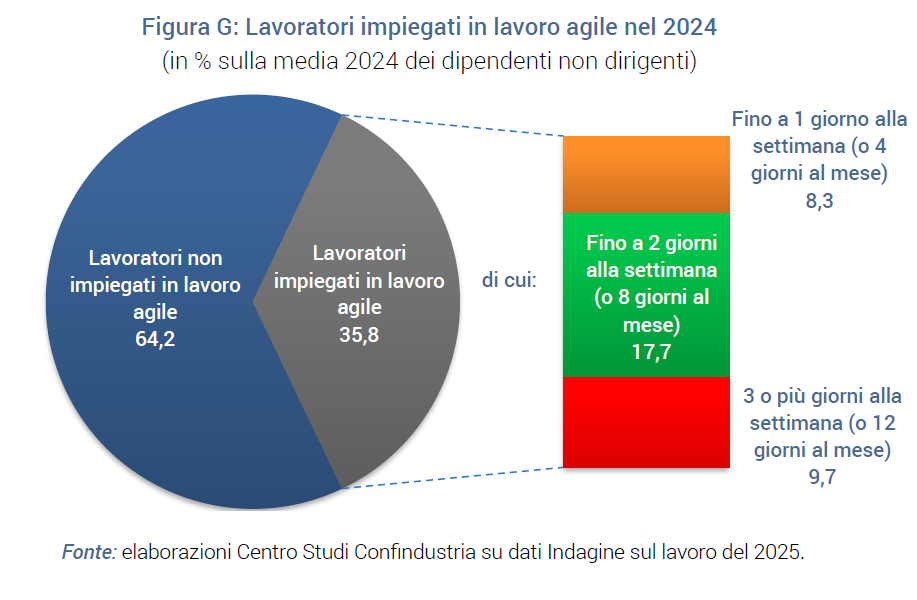
Turning to an analysis of the intensity of use of agile work, it appears that, in the companies where it is envisaged, more than one third of non-managerial employees used this mode of work (35.81 FTE6T), with no substantial differences between the figure for industry (34.91 FTE6T) and that for services (37.21 FTE6T). More specifically, 8.3% of employees used it for a maximum of 1 day per week (or 4 days per month), 17.7% chose this mode for a maximum of 2 days per week (or 8 days per month), and 9.7% for 3 or more days per week (or 12 days per month; Figure G).
3.5 Difficulties in finding skills for more than two out of three companies
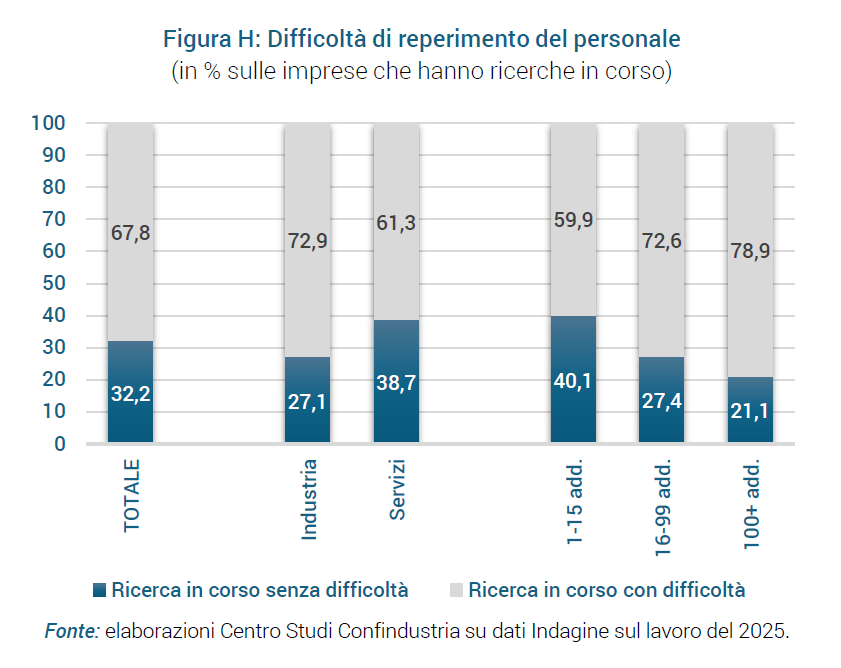
As in the previous edition, companies were asked in this year's survey whether they encountered significant difficulties in their recruitment policies. Among the companies that had ongoing personnel searches at the time of filling out the questionnaire5 , 67.8% reported that they had encountered difficulties, a percentage very similar to that found a year earlier (69.8%).
The share of firms reporting difficulties is higher in industry (72.9%) than in services (61.3%) and increases with firm size, from 59.9% in small firms, to 72.6% in medium-sized firms and 78.9% in large firms (Figure H).
The greatest problems emerge for technical skills (such as maintenance, installation and technology, production, logistics, basic IT, etc.), reported by more than half of the companies as being difficult to find (57.1%). Finding difficulties for manual jobs are also widespread (46.3%), especially in industry (57.6% compared to 31.8% in services; Figure I).
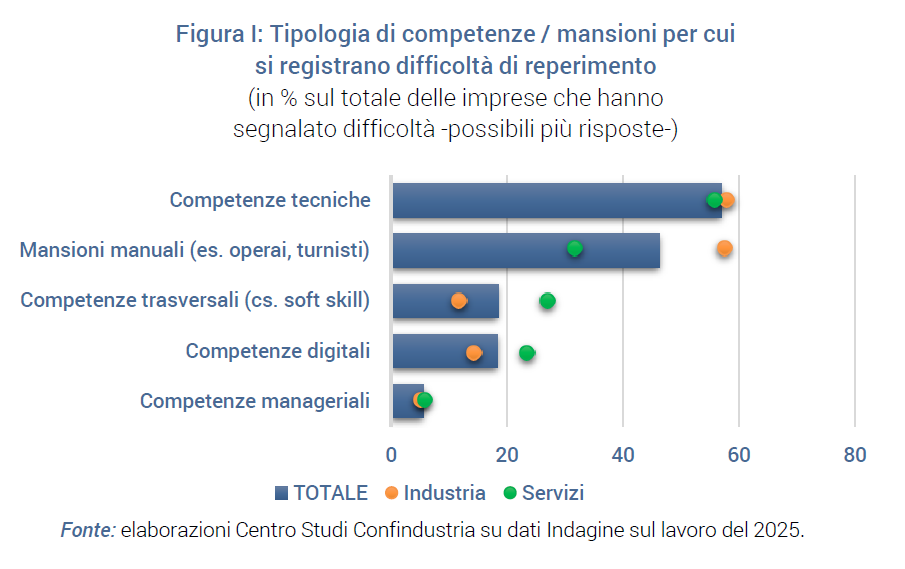
There is also almost a fifth of companies (18.5%) that report difficulties in finding transversal skills. On the other hand, digital skills (e.g. for design, prototyping, digital infrastructure development, algorithm development and management, data analysis, etc.) are also difficult to find for a similar proportion of companies (18.4%). For these two types of skills, it is the service enterprises that detect a shortage more frequently than the industry enterprises.
Less widespread, both in industry and in services, were the reports concerning managerial skills (5.6%), a result that should, however, be read in the light of the lower frequency of searches for these figures.
Most of the companies reporting recruitment difficulties (84.1%) take action to deal with them. Among the companies that indicated at least one 'countermeasure' in place, the most common is the training of their current staff (56.0%), followed by the use of external services, such as consultancy and collaborations (52.9%) and the widening of the search pool in terms of geographical areas or recruitment methodologies (40.2%).
It should also be noted that almost a third of the companies are involved in educational programmes in the area (ITS Academy, PCTO, curricular internships, etc.).
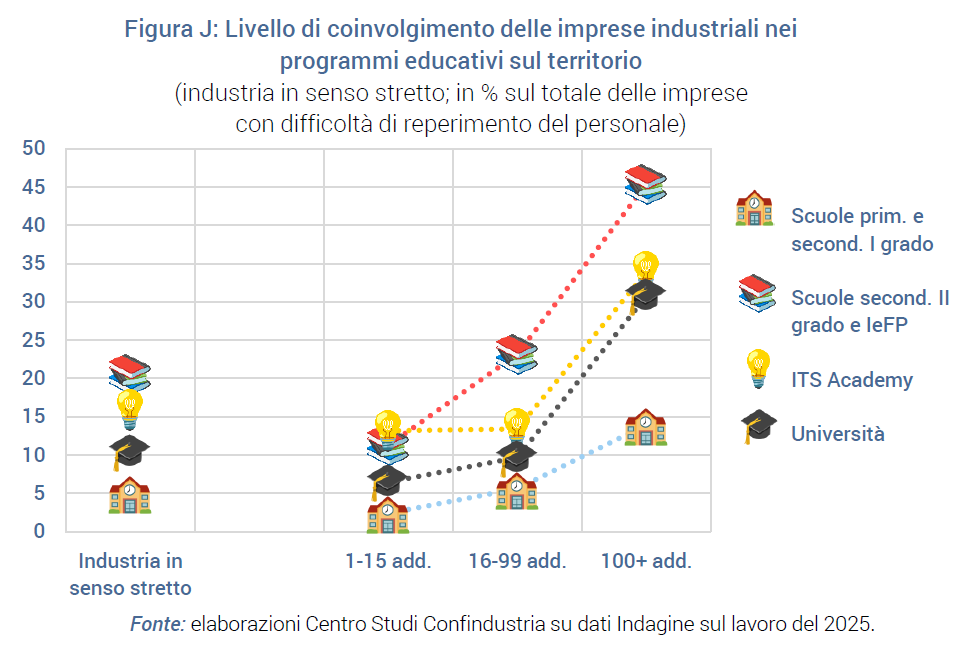
In this regard, an ad hoc study shows that in the panorama of industrial companies associated with Confindustria, those encountering difficulties in recruiting personnel are more frequently involved with high schools and vocational education and training (IeFP) courses (20.6%). This is followed by ITS Academy (15.9%) and universities (10.4%), while involvement with primary and middle schools is at a lower level (5.0%).
The propensity to involvement grows significantly according to company size: companies with 100 or more employees show more than double the frequency of involvement with high schools and ITS Academy than the average (45.3% and 33.8% respectively) and even more than triple for primary/middle schools (13.9%) and universities (30.7%; Figure J).
4. The adoption of AI in Confindustria System companies: areas, HR actions undertaken, difficulties and observed and expected effects
This year's survey takes an in-depth look at the adoption of Artificial Intelligence solutions by Confindustria member companies, with a specific focus on the initiatives undertaken in the field of human resources to foster the integration of AI in business processes. The analysis also provides an insight into the main areas of application of AI, the difficulties most encountered by companies along the adoption path, and the effects - already observed or expected - that its introduction is generating in organisational and production terms.
4.1 Diffusion of AI
In terms of deployment, it is noted that 11.5% of member companies have already adopted and regularly use AI tools in their business activities (e.g. process automation, data analysis, chatbots for customer support, marketing, logistics) or are experimenting with their adoption (e.g. pilot projects, testing of key processes). Another 37.6% are evaluating the adoption of AI solutions (e.g. analysis phase or research of technologies and suppliers, feasibility analysis). Half of the member companies, therefore, have already adopted AI solutions or are considering their introduction, while the other half do not plan to use them (Figure K).
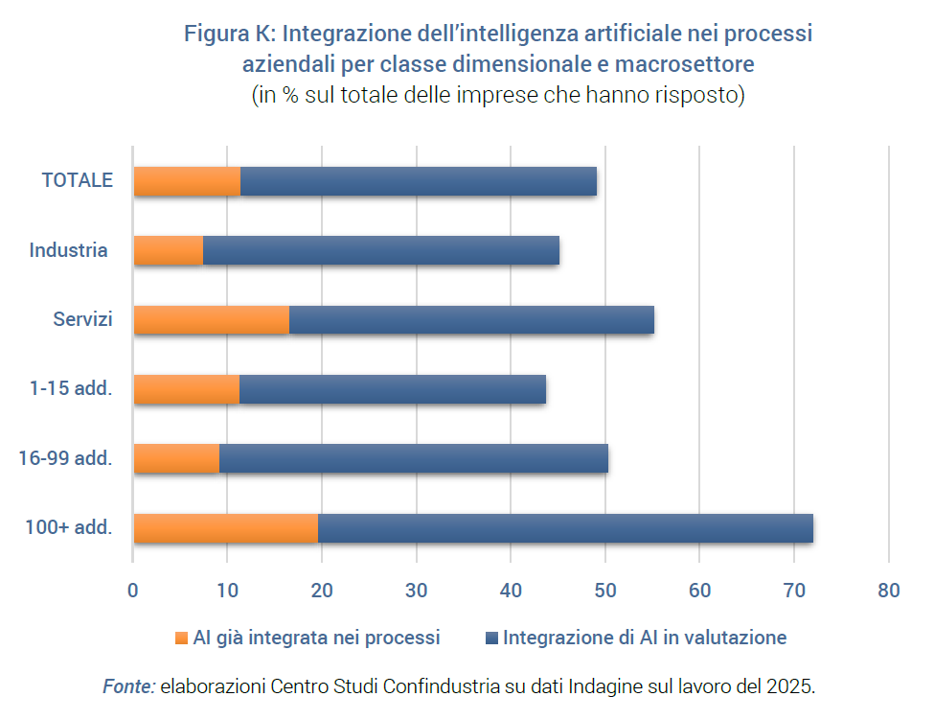
The adoption of AI varies significantly by company size. Larger companies show a greater propensity to integrate AI solutions, probably due to a greater ability to manage innovative processes. Medium-sized companies (16-99 employees) are in an intermediate position: they show similar levels of use to small ones, but comparable interest to large ones.
Strong differences are also observed at sector level: actual adoption is much more widespread in services (16.6%) than in industry (7.5%). This gap reflects greater process digitisation and fewer infrastructural constraints in the service sector. However, the fact that the share of companies actively considering its adoption is also high in industry (37.5%, close to 38% in services) indicates an ongoing catch-up process.
4.2 Actions taken in human resources and adoption difficulties
Companies that have adopted or are actively considering adopting AI solutions were asked whether, on the human capital side, they have taken steps (and which ones) to integrate AI into their processes.
Among the main initiatives in the area of human resources, the most widespread is the training of internal staff to develop specific skills, adopted by 72.2% of companies. This is followed by the involvement of external consultants or suppliers for the introduction of Artificial Intelligence (39.9%). In addition, about one in ten companies (10.3%) stated that they had undertaken search and selection activities for technical profiles specialised in AI (Figure L).
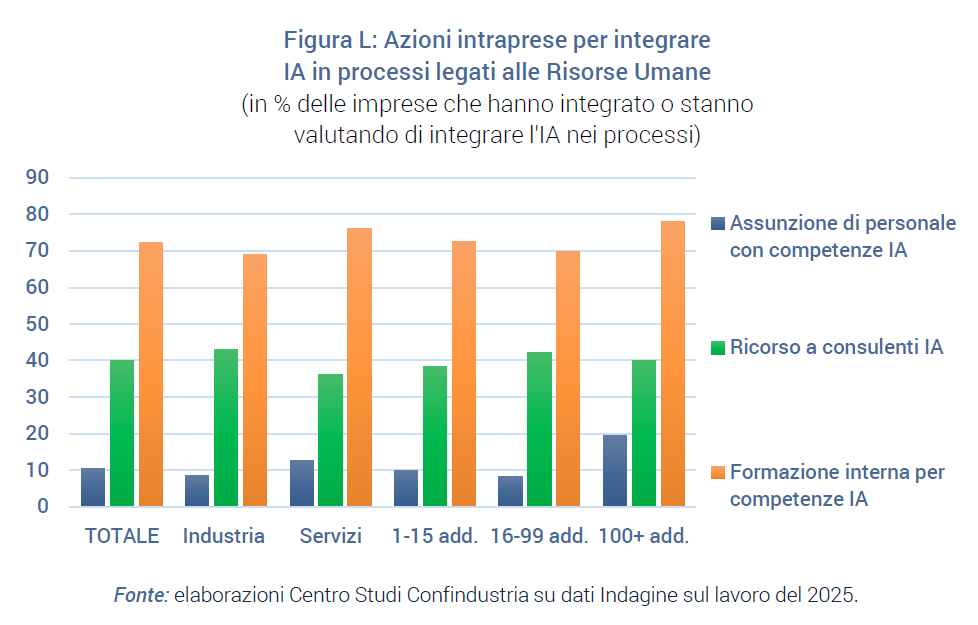
The analysis of the actions introduced to integrate artificial intelligence into HR processes shows differences according to company size. Companies with more than 100 employees show a more structured and articulated approach: almost 80% invest in internal staff training, 40% make use of external consultants or suppliers, and almost one in five has already started recruitment paths for technical profiles specialised in AI.
Medium-sized companies (16-99 employees) adopt similar strategies, but to a lesser extent. Also in this group, training remains central (over 70%), while the use of consultants is slightly more widespread than in the other size classes (just over 40%); recruitment of specialised personnel, on the other hand, remains more limited (under 10%).
Finally, micro and small enterprises (1-15 employees) focus almost exclusively on internal training (72%), while the use of external consultancy (39%) and especially the recruitment of new profiles (8%) are much more limited.
Although 43.71 FTE6T of companies have undertaken at least one of the actions aimed at fostering the integration of AI in production processes, there is still a large proportion of companies - 56.31 FTE6T - that have not launched any HR initiatives. This value tends to decrease slightly as company size increases, falling to 47.2% among companies with over 100 employees, but it is still high. This is an important indicator, to be monitored over time, as it signals the need to strengthen the organisational capacity of companies to meet the challenges of AI adoption.
The crucial role of human resources management and organisational innovation, clearly not yet in step with technological innovation, is, moreover, very evident from the answers on the difficulties encountered in adopting AI solutions. The main criticality reported by companies, in fact, is precisely the lack of adequate internal skills, indicated by more than one in three companies (36.7%; Figure M).
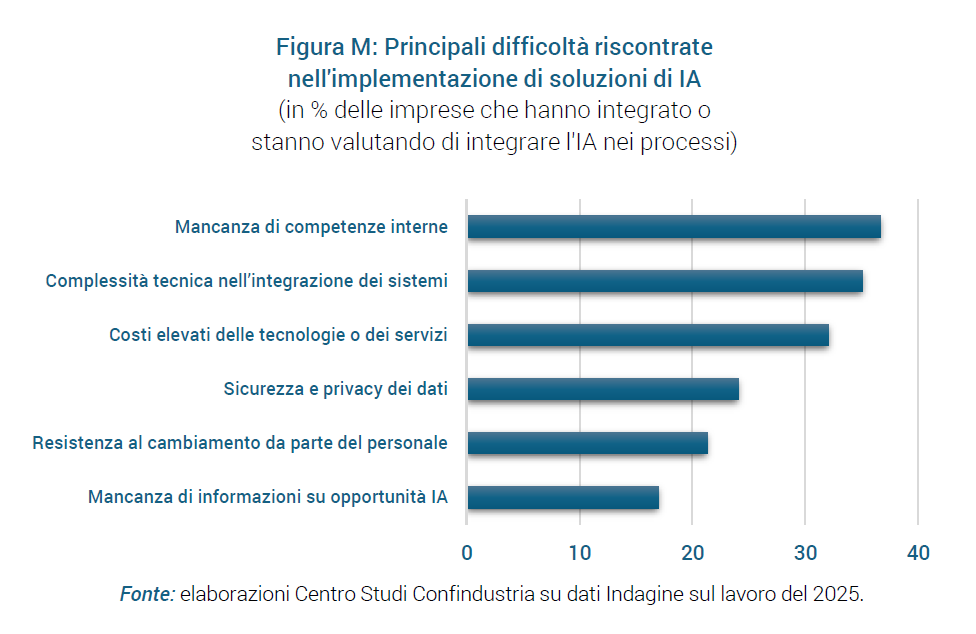
Other difficulties widely reported by businesses are also at least partly attributable to the need to strengthen human capital, both in terms of technical and transversal skills (soft skills) to accompany and maximise the effectiveness of technological innovation. Among the difficulties in adopting AI, 35.1% of businesses report the technical complexity associated with integrating production systems; 21.3% indicate resistance to staff change as a barrier to the introduction of artificial intelligence; 17.3% of businesses report a lack of clear information on the opportunities offered by AI.
Last but not least, the survey also notes the barrier of the cost of AI technologies and services (still too high for almost one in three companies) and the barrier of managing large amounts of data, particularly in terms of security and privacy (a barrier for almost one in four companies).
4.3 Scope of IA
Among companies that are already at an advanced stage of adoption and/or experimentation of AI, business data analysis and management is the most widespread field of application of AI, involving approximately 48% of companies (Figure N). The average share is similar in services and industry, but increases with company size (it stands at 35.4% among those with up to 15 employees).
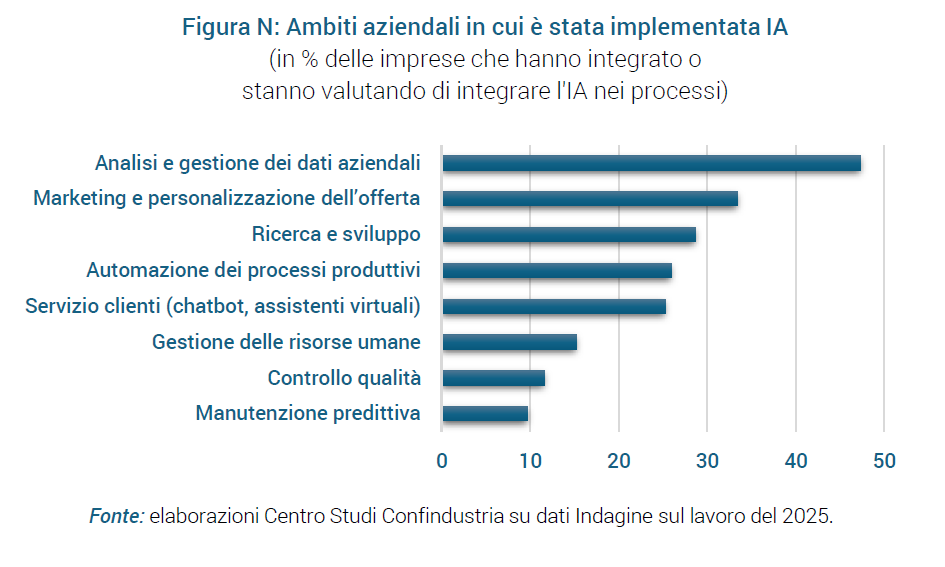
This is followed by marketing and the personalisation of the offer, for example, through customer profiling, which involves about one third of the companies (33.4%), a share that is almost constant in all size classes, but rises to 45.2% in services, against 24.3% in industry.
In third place was the application for research and development (indicated by 28.7% of the companies), with a similar average spread across both size classes and sectors.
About one in four companies use AI for automation of production processes and customer service, e.g. via chatbots or virtual assistants. However, automation is more common in industry and customer service in the service sector. For both, usage increases greatly with company size. Narrowing the field to companies with 100 or more employees, in fact, the application of AI for automation and customer service affects almost half of the companies, industrial and services respectively. 15.2% adopt AI solutions in the field of human resources (around 30% among the largest), while lower percentages, around 10%, are recorded for applications in predictive maintenance and quality control (slightly more widespread among large and industrial companies).
4.4 Observed and expected effects of AI adoption
The adoption of AI opens the way to significant transformations in production and organisational processes, with implementation times varying according to the technologies adopted as well as the specific characteristics of each company. In order to have an idea of the impact of AI - already observed or expected - on various company variables, the survey collected the evaluations of companies that have already adopted it structurally or experimentally. The most immediate effect reported by companies is the automation of repetitive tasks: 44% say they have already observed its effects, and a further 42% expect them to occur in the future (Table B).
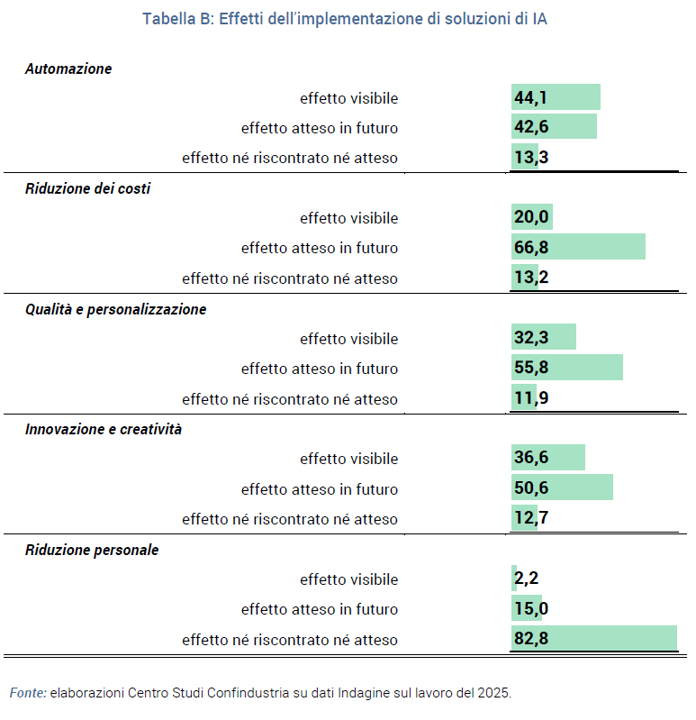
Two other effects already visible for a high share of companies are the improvement in the quality and/or customisation of the products/services offered (32.3%) and the benefits in terms of innovation and creativity (36.6%). For both benefits, an even larger share of companies say they expect them in the future (55.8% and 50.6% respectively).
Reducing costs is an effect that, although currently experienced by one in five companies (20.0%), is considered achievable in the future by as many as two in three companies (66.8%).
Finally, staff reduction emerges as a marginal effect of the introduction of AI: only 2.2% of companies claim to have already experienced it, and a relatively small proportion (15%) expect it to occur in the future.
5. Appendix: The characteristics of the Confindustria Annual Labour Survey
5.1 Edition 2025
This note examines the results of the Confindustria Labour Survey 2025 which, as in previous editions, went into the field in the early months of the year. The administration of questionnaires by the Confindustria System Associations to their member companies began on 17 February 2025, with a deadline initially set for 21 March, later extended to 4 April.
This year's response sample consists of 3,359 companies. In total, the companies in the sample employed 719,630 employees nationwide at the end of 2024.
As in previous editions, this year's questionnaire includes questions on working hours and absenteeism, the structure and dynamics of the workforce employed under different types of contracts and company policies, with particular reference to company bargaining, hard-to-find skills and human capital. The questionnaire confirmed the in-depth study on the use of agile work and included a specific section on artificial intelligence.
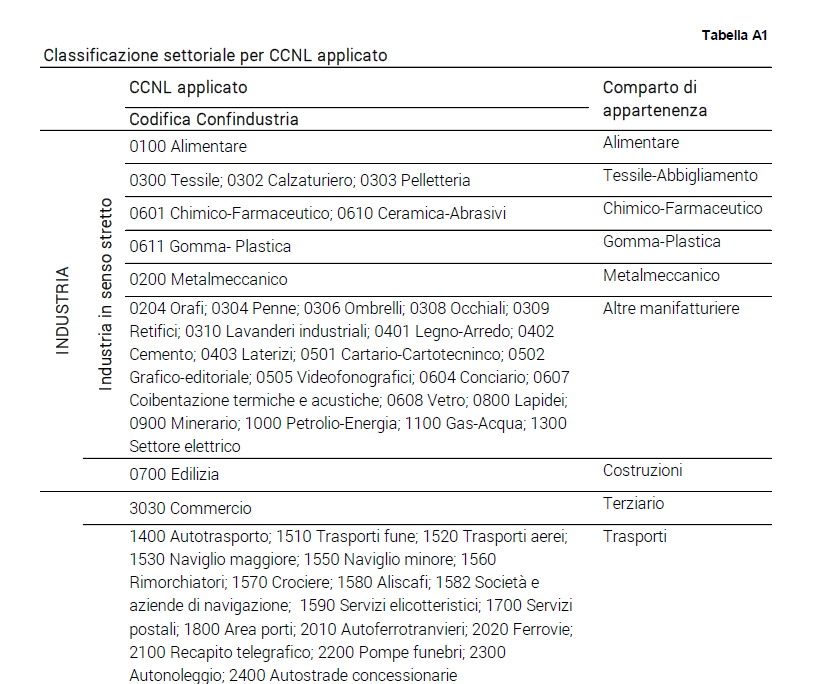
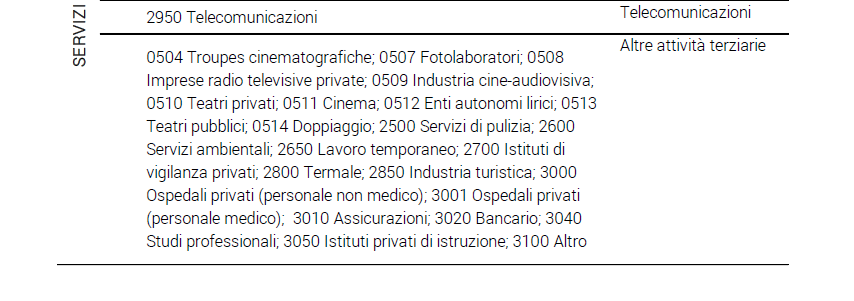
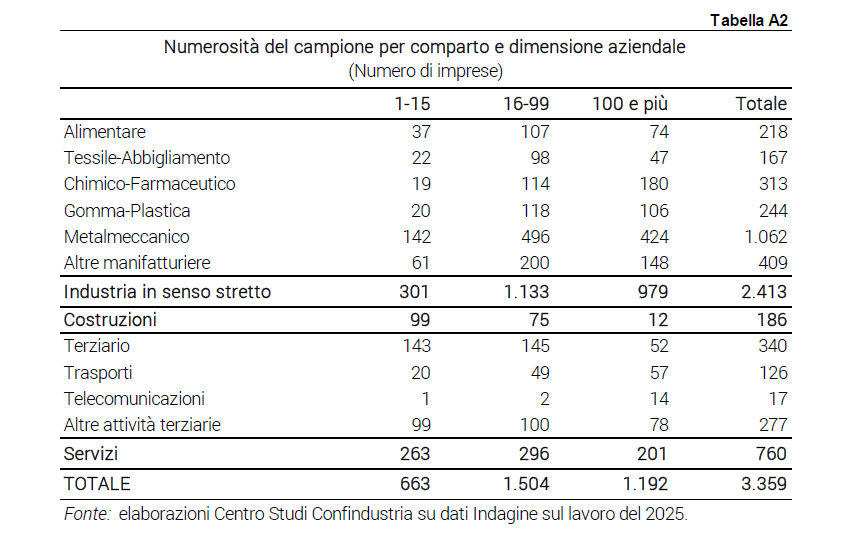
In the presentation of the survey results, the companies in the sample are classified by sector on the basis of the applied CCNL (Table A1) and by company size on the basis of the number of employees as of December 2024. Details on the composition of the sample by industry and number of employees are given in Table A2.
In this note (as in those drawn up to comment on past editions of the Confindustria Labour Survey) the average results at national level are weighted on the basis of the distribution (by 11 sectors and 3 size classes) of enterprises or employees in the total number of Confindustria member companies, depending on whether the variables are specified at company level (e.g. share of companies applying a company contract) or with respect to the workforce (e.g. share of workers covered by a company contract), respectively.
5.2 Hours and absences from work: definitions and calculation methodology
Workable days are calculated by subtracting the 366 days of the year:
- Saturdays and Sundays (104 days) and public holidays in 2024 (9 days);
- the company's figures for holidays, P.A.R. days (former holidays and reduced working hours) and time bank and time account leave.
The annual working hours are calculated:
- by multiplying the days that can be worked by the normal weekly working time of full-time staff net of paid breaks, divided by five;
- by subtracting the per-capita hours of lay-offs carried out by staff.
The absenteeism rate is calculated as the percentage ratio of hours of absence to hours worked, and is available by gender, qualification and type of absence.
The results are based on the answers provided by the 3,133 sampled companies that filled in the section of the questionnaire on working hours and absenteeism.
Related


Join the largest business community in Italy.
Highlighted topics
Our Platform