Share on
This note attempts to shed light on the state of progress of the PNRR by analysing available public documents and data from ItaliaDomani and the REGIS platform. The analysis is organised around 4 themes:
-
The impact of the PNRR on GDP growth. In the Budget Structure Plan (PSB) of the end of September, the impact of the PNRR on Italian GDP growth was revised downward in 2024 and 2025, and upward in 2026 with respect to what was indicated in last April's DEF. The most recent estimates seem to discount not only a delay in the implementation of measures compared to what was planned, but also a deterioration in the degree of efficiency ('medium' and no longer 'high') in spending resources.
-
Financial and project planning: the numbers of the NRP. The expenditure forecast as of 31 October 2024 was EUR 58.6 billion (30% of the total 194.4 billion resources available). However, monitoring of financial and project planning shows that as of 13 December, 95% of the Plan's resources had been activated and contracts (committed resources) worth 125 billion (64%) had been signed.
-
Expenditure incurred and potential spending delays, measure by measure. Expenditure of EUR 42.2 billion was planned for 2024. The 14 billion recorded on REGIS as of 31 October mainly concerned measures such as tax credits, railway investments, and investments in school construction. Among the most critical measures, i.e. with an expenditure level below 25% of the planned up to 2024, are 'active labour market policies (ALPMs)' and 'zero net emission technologies' and 'agricultural sector contracts'.
-
The international comparison. Despite possible spending delays, the Italian plan is advancing at a faster pace than other countries. Italy has reached 43% of the targets and objectives agreed with the European Commission against the average 28% of countries with a plan worth at least 5 billion; it has also received 63% of resources, well above the European average of 48%.
Disclaimer: On 29 November 2024, the Government declared that: "The 2024 figures on total expenditure, currently around EUR 59 billion - in the process of being updated on the REGIS platform for their alignment with the real Italy of open construction sites and completed investments - show an increase of about EUR 17 billion during the first ten months of the year, on a steady growth path that by 2024 is expected to reach about EUR 22 billion, in line with updated public finance forecasts'.
This note reports values that are not entirely in line with the government's latest statement because they refer to a data collection carried out about a month earlier:
-
expenditure until 31 October 2024 is 14 billion, which is about 3 billion less than the 17 billion declared by the government;
-
In addition, a new revision of the Plan is underway, so it is likely to expect a further change in the expenditure planning of some measures, including those in 2024 (it is plausible that they will drop from 42.2 billion in 2024 to the 22 mentioned in the government statement).
It was not possible to update the data contained in this note because since 7 November, Confindustria no longer has access to the REGIS platform, but only to data from ItaliaDomani, which are, however, insufficient to provide an accurate and timely overview of the Plan's progress. Nonetheless, although we are aware of a margin of error due to some time discrepancies and a financial plan that is not perfectly up-to-date, we nevertheless consider it useful to publish this document in order to shed light on how the 58.6 billion has been used to date, while waiting for new data to be released by the government.
1. The impact of the NRP on GDP growth
What has been and what will be the impact of the NRP on GDP in the coming years? After an initial ex-ante impact assessment provided in the Plan's launch document (April 2021) under various spending efficiency assumptions, the government has revised the planning several times, most recently in the Budget Structure Plan (PSB) at the end of September. It is precisely in the PSB, however, that it is not clear which of the various impact estimates contained therein is the one taken as a reference, and therefore considered most plausible, in the formulation of the forecast macroeconomic framework.
This section provides a commentary on the most up-to-date government estimates of the PNRR's impact on Italian GDP, in order to understand how the government judges the effectiveness of the Plan's implementation.
1.1 What does the latest revision of the estimates say?
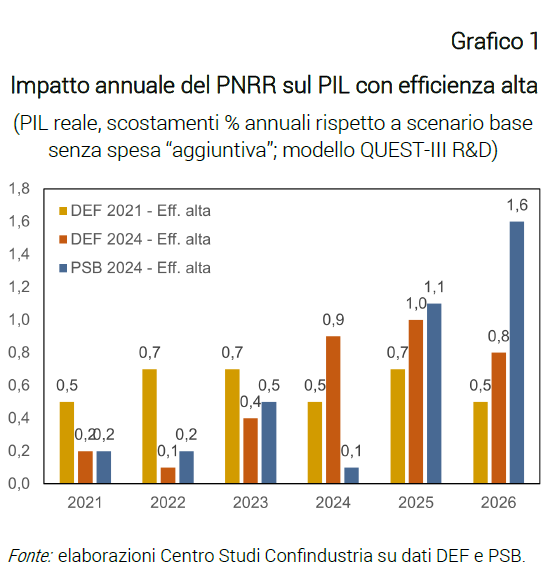
The April DEF projected an impact of the NRP on GDP of 0.9 percentage points (p.p.) of additional growth for 2024, but in the updated PSB estimate, with only a few months to go, the estimated impact has collapsed to 0.1 p.p.
Downward revisions on impact estimates had already occurred in the past: for example, for 2023 the estimated annual impact of the NRP went from +0.7 p.p. in the 2021 DEF to +0.5 p.p. in the 2024 DEF, i.e. "on balance" with respect to information on actual expenditure. Even larger revisions were recorded for 2021 and 2022 (Graph 1).
Methodological notes
-
The impact is calculated as the difference between a scenario in which the Plan is realised ('with PNRR') and a baseline, hypothetical scenario in the absence of the measures in PNRR ('without PNRR');
-
The impact estimates commented on here only consider the effect of 'additional' resources;
-
The impact is estimated under different assumptions of spending efficiency (high, medium or low), where lower grades discount delays, errors in the selection, design and implementation of investments;
-
Impact estimates are formulated either as a cumulative impact from its inception (2020) until 2026, or as an annual impact (i.e. how much the Plan is estimated to increase GDP from one year to the next).
On the other hand, the Plan's impact estimates for the first years of implementation were lowered by the government in tandem with the revision of the time distribution of expenditure per year, which was also systematically shifted forward (Chart 2).

At the same time, however, the government in subsequent revisions has kept the cumulative impact to the last year almost unchanged, under the implicit assumption that all resources will in any case be spent within the 2020-2026 implementation window.
By keeping the cumulative effect to 2026 almost fixed, downward revisions of the annual impact on the first years of implementation mechanically translate into upward revisions on the years to come.
In the PSB, the cumulative impact estimate to 2026, under the high efficiency assumption, was revised slightly upwards compared to the April DEF, from 3.4 p.p. to 3.7 p.p.
This becomes a problem now that the Plan is only two years away. In particular, the 0.8 p.p. of additional growth that 'disappeared' from 2024 (see Chart 1) was almost entirely attributed to the last year: in fact, the estimated impact of the NRP on 2026 GDP doubled, from +0.8 to +1.6 p.p.
Such a large additional growth estimate, however, raises many questions. Taking it literally and imagining that by 2026 the scenario without NRP is aligned with the average annual pre-pandemic growth (+0.5%), with a very rough calculation one should expect GDP growth over 2%. But national and international forecasters now give growth in 2026 at around 1%, so they do not seem to discount such a large Plan impact scenario.
1.2 Implementation efficiency
As mentioned above, government impact simulations are formulated under assumptions of varying degrees of efficiency. The initial NRP of April 2021, in particular, presented a range of ex-ante impact estimates under three efficiency levels. Since then, only the impact estimate under the high efficiency assumption has always been updated and used in official documents. The government, however, has never explicitly clarified which hypothesis it considered most plausible, not even now that a few years have passed, which is sufficient to make an initial assessment of the quality of the measures already implemented. From what emerges from the PSB, for the first time the government would appear to judge the degree of efficiency in the implementation of the NRP expenditures made to date as 'average'. In fact, if one compares the annual profile of the impacts on GDP for investments (divided into "already implemented" and "to be implemented") of Table III.4.1 of the PSB with that described in the scenario with average (so-called "prudential") efficiency of Table A.V.1 of the PSB, they appear to be quite equal (Table A).

2. Financial and project planning: the PNRR figures
This second section analyses the key "numbers" that help outline the financial and project planning of the NRP, offering a clearer view of the procedural stages through which the expenditure of resources is developed. The amount of expenditure incurred or carried out, equal to €58.6 billion as of 31 October, is perhaps the best known figure to indicate the progress of the Plan; however, considering only this figure risks obscuring a complete understanding of the progress of the entire Plan. In fact, the REGIS monitoring and reporting system allows, through specific indicators, to quantify in detail the various stages of upstream planning, making visible the progression of the utilisation of the EUR 194.4 billion of RRF financial resources (Chart 3).

2.1 How is the financial and project planning of the NRP proceeding?
It seems useful to illustrate the six key values, the first three of which relate to financial planning and the next three to project monitoring.
The first value concerns the amount of the activation procedures (PRATT), which as of 13 December amounted to EUR 184.4 billion (95% of the total RRF). These are resources for which an ex-ante allocation criterion has been defined by means of a public act by the Administration in charge of the measure. Therefore, they are resources for which the formal authorisation to start the expenditure activities (eligibility criteria, guidelines, etc.) has been issued. About 10 billion are missing to be 'activated'. This is a first value to be monitored because it allows us to understand the 'non-activations' of certain measures.
The second value concerns the amount of the agreements, which amounts to EUR 161.7 billion (83% of the total RRF). These are resources related to the selected projects for which an agreement has been signed between the Title Authority (the Ministries) and the Implementing Entities (local authorities, public and private entities, etc.). In practice, it is the sum that the Government decides to make available for the implementation of the planned activities. A lower amount than the PRATT indicates a delay in signing the agreements (e.g. allocation decrees) or a different accounting, e.g. tax credits, only partially registered.
The third value concerns the allowable cost of the projects, which amounts to EUR 140.5 billion (72%). This is the amount of resources earmarked to cover the costs that can be financed through the contribution of the NRP, as defined by the titular administration. Returning to the example of tax credits, unlike the first two values, where they automatically resulted in a PRATT and a convention, here tax credits are only accounted for against applications made by beneficiaries (e.g. Ecobonus, Sismabonus and Transition 4.0).
Two caveats in reading these first 3 values. Firstly, although there is a certain hierarchy in the amounts of each stage of progress (in the sense that the amount of the PRATTs should be greater than the amount of the agreements, which in turn should be greater than the admitted cost of the projects), there are situations in which this is not the case: this is the case of measures that combine RRF resources with other resources, e.g. the Complementary Fund, other NGEU funds or own resources. Secondly, as has happened in the past, some of the three above-mentioned values may exceed the total allocation of Plan resources: this happens if, in order to ensure a margin for the achievement of the envisaged targets and objectives, several projects are allowed.
The fourth value concerns the financial commitment for projects, which amounts to EUR 125.1 billion (64%). These are the resources earmarked by the Implementing Entities for the payment of one or more parties carrying out the works or providing services. They are, therefore, legally bound resources, since there is a legal obligation to pay (e.g. a contract has been signed between a local authority and a service provider). For this reason, the value of commitments is a good approximation to know how many projects will be implemented in the future.
The fifth value concerns project payments, which amounted to 57.5 billion (30%). This is the value of the expenses actually paid by the Implementing Entities to the implementing entities, against the invoices submitted. It is a "cash" expenditure value.
The last value, the best known, concerns the forecast of expenditure incurred, amounting to 58.6 billion (30%). This is the forecast value of the reimbursements certified by the Titular Administrations in favour of the Actuating Entities. It is a kind of "accrual" expenditure value and does not necessarily coincide with the "cash" expenditure value mentioned above. It should coincide with the realised economic value, i.e. the economic value at the state of advancement of works (SAL) of the works carried out to date or of the goods or services purchased.
A concrete case to clarify. By way of example, we analyse the various procedural steps for investment M4C1I3.2 'School 4.0 - innovative schools, new classrooms and laboratories' of mission M4-Education and Research. EUR 2,100 million has been allocated to this measure from the RRF fund alone. The Ministry of Education and Merit activated procedures for 1,867 million (the Ministry is also the Implementing Party for this measure). As a difference, 233 million are still to be activated. The amount of the conventions is worth over 1,828 million, while the admitted cost of the projects is only a few thousand euros less, worth almost 1,828 million. The Actuator has already signed contracts for 1,658 million and paid invoices for 1,135 million. The expenditure forecast is worth EUR 1,122 million, but it is likely that this value will be updated upwards shortly. In fact, the investment seems to be going better than expected: by 2024, expenditure of EUR 501 million had been planned, but this figure is now four times higher (+224%).
3. Expenditure incurred and potential delays
This chapter qualifies the expenditure to date, identifying measure by measure where resources have been spent and where delays could occur. For each measure, an indicator has been constructed that visualises possible critical situations, thus providing an alert signal so that stakeholder e policy maker can take timely action to achieve the relevant targets and objectives set out in the Plan. Then, an overview is given of what will be the greatest challenges, in terms of NRDP spending, to be faced in the future. Finally, it concludes with some considerations for a correct interpretation of the numbers presented.
3.1 How much has been spent so far?
As already highlighted, the figure commonly used to summarise the progress of the Plan is the expenditure incurred, as of 31 October, equal to 54.1 billion euro, i.e. 67% of the endowment of resources expected by the end of 2024, equal to 87.6 billion; by difference, in the two months missed, 32.7 billion should theoretically have been spent by the end of the year, excluding the hypothesis of a partial postponement. On the other hand, if the expenditure incurred is assessed against the overall RRF allocation, the percentage drops to 30% and the resources to be spent rise to 136 billion by the end of 2026 (Chart 4). In fact, more than 57 and 49 billion are planned to be spent in 2025 and 2026, amounts that are quite substantial.
Using REGIS and ItaliaDomani data, it is possible to examine in detail how the EUR 58.6 billion were used, measure by measure. The analysis makes it possible to highlight both successes and any critical points in the spending path, providing a precise picture of the Plan's progression.

To make it easier to understand, a synthetic indicator (the so-called "alert") has been developed that, for each measure, indicates the riskiness, in terms of distance, in reaching the planned expenditure target. The indicator is very simple; it is based on the ratio of expenditure incurred up to 31 October 2024 to planned expenditure from 2020 to 2024. A higher risk is associated with measures with lower percentages, i.e. between 0% and 25%. As one goes up the percentage classes (25-50%, 50-75%, 75-100%), the associated risk gradually decreases. In addition, the indicator takes into account the size of the measure: it was arbitrarily chosen to judge as more risky those projects whose planned expenditure amount exceeds 500 million. By doing so, the indicator allows the identification of those measures that may require corrective action to remain in line with the Plan's financial planning.
A complete list of the measures and their status is given in the Appendix.
3.2 Where was it spent?
Considering only the first 20 measures of the NRP by amount spent, the level of expenditure appears to be rather high on average: 43.8 billion, i.e. 94% of the 46.5 billion planned for the period 2020-2024. In contrast, the other measures, whose total expenditure to date has amounted to 14.8 billion, show a much lower average level of expenditure, amounting to 36% of the planned 41.1 billion (Chart 5).

At the level of individual measures, the resources spent mainly concerned three areas: tax credits (Ecobonus, Sismabonus, and Transition 4.0), railway investments (high-speed lines and other regional connections), and investments in school buildings (schools, kindergartens, canteens, gyms). Among other things, it is clear that half of the expenditure is attributable to automatic measures (26.7 billion, the 46%) and another part to investments already in place at the start of the Plan, i.e. those for high-speed railway lines (6.1 billion, the 10%).
Also among the top 20 measures by expenditure, as many as 14 have a level of expenditure above 75% (alert with green dot); five of these even have a percentage above 100%, a sign that they have spent more than planned and are therefore proceeding more quickly than planned. Of the remaining 6 measures, 5 have an expenditure percentage in the range 50%-75% (alert with yellow dot) and only one in the range 25%-50% (alert with red dot). Moreover, all these remaining 8 measures have a further critical signal in the alert indicator because their planned expenditure to 2024 is above the threshold of 500 million, making their achievement probably more challenging.
3.3 Where are there potential expenditure delays?
Considering as 'critical' those expenditure measures characterised by a planned expenditure of more than 500 million and low expenditure levels, between 0% and 25% or between 25% and 50%, it emerges that out of 16.3 billion, only 3.0 billion was spent in total, i.e. 18% (Chart 6). Among the least performing measures, with a lower level of expenditure than 25%, are 'active labour market policies (ALPMs)', 'zero net emission technologies' and 'agricultural sector contracts'. For the former, EUR 2.6 billion was planned to be spent by 2024, but as of 31 October only EUR 182 million, the 7%, had been spent, thus lagging far behind; for the latter, about EUR 2 billion was planned to be spent each, but as of 31 October no expenditure had been made.

On the other hand, measures with a level of expenditure between 25% and 50% include the Nursery School Plan, Investments in urban regeneration projects and combating social hardship, and Partnerships extended to universities, research centres, businesses and financing basic research projects. These measures are to be closely monitored.
When evaluating these delays, the time distribution of planned expenditure until 2026 must also be taken into account. Any delay in spending in 2024 could easily be made up the following year, especially if in the following years the amounts of planned spending are smaller: for example, the Net Zero Emission Technologies measure does not plan any spending after 2024 and in the case of a delay there would be some margin to realise it by the end of the NRP. Vice versa, in the case of high amounts also in the 2025-2026 biennium, certain measures could become more difficult to complete, and therefore risky, should the delays in 2024 materialise: this is the case, for example, of the measure 'Development of biomethane, according to criteria for promoting the circular economy', in which the planned expenditure will increase threefold, up to 1.9 billion, to which the potential delays accumulated in 2024 (i.e., the 500 million planned to date but not yet spent) must be added.
3.4 Where will the resources be spent?
Chart 7 documents expenditure (made and/or planned) disaggregated by year and by mission, revealing a certain heterogeneity in the status of expenditure. It is based on REGIS data as of 17 October, totalling 54.1 billion and could not be updated with data from ItaliaDomani. Although some 4.5 billion is missing from the 58.6 billion as of 31 October, it is useful to analyse the general trends for each mission.
Until 2022, for all missions, the expenditure carried out coincides almost completely with the planned expenditure, also due to the planning revisions that have been carried out to achieve alignment. Only the mission M3 - Infrastructure for sustainable mobility shows a slight delay.
For 2023, on the other hand, it can be seen that for mission M4 - Research and Development, more was spent than originally planned (about 3.1 billion against the planned 2.0 billion); conversely, for mission M5 - Inclusion and Cohesion, a delay in expenditure of about 1.3 billion against a planned expenditure of 2.1 billion is noted.
For 2024, the spending delay is common to all missions. Overall, as of 17 October, only 9.5 billion out of the planned 42.2 billion had been spent; therefore, 32.7 billion remained to be spent by the end of the year. Only the mission M6 - Health has exceeded 50% of the planned expenditure, while all the others are on lower percentages (on average 23%).
For 2025 and 2026, all missions, except M1 - Digitalisation, Innovation, Competitiveness, Culture and Tourism, show that the spending peaks have yet to occur.

Going back to the most recent expenditure figures (58.6 billion in Italia Domani of 31 October), it appears that 135.8 billion still remain to be spent, including the missing resources in 2024, as broken down below.
For M1 - Digitalisation, innovation, competitiveness and culture:
-
2.5 billion for the 1 Gbps Italy Plan;
-
2 billion for net-zero technologies;
-
1.3 billion investment in human capital to strengthen the Process Bureau; followed by many other measures of less than or close to 1 billion.
For the M2 - Green Revolution and Ecological Transition:
-
3.0 development of mass rapid transport;
-
2.5 billion smart grid reinforcement;
-
2.2 for the agricultural park;
-
2.2 to promote renewables for energy communities and self-consumption;
-
2 for the expansion of the regional bus fleet for public transport;
-
This is followed by a further 7 measures with an amount exceeding 1 billion;
For the M3 - Infrastructure for sustainable mobility:
-
2.0 to develop the traffic management system (ERTMS);
-
1.9 for the upgrading of railways in the South;
-
1.8 for the upgrading of railway nodes;
-
1.8 billion for high-speed lines (Liguria-Alpes);
-
7.3 billion for other measures also related to the improvement of the railway system.
For the M4 - Education and Research:
-
3.3 billion for school construction;
-
2.4 for the nursery and kindergarten plan;
-
1.4 for IPCEIs (Major Projects of Common European Interest);
-
6 other measures have amounts between 1 and 1.4 billion.
For M5 - Inclusion and Cohesion: expenditure is concentrated around three main measures, namely:
-
5.3 billion for active labour market policies and vocational training;
-
1.9 billion for social housing;
-
investments in urban regeneration and against social decay amounting to 1.5 billion;
-
all other measures have amounts of less than one billion.
For the M6 - Health:
-
2.6 billion for the 'Home as the first place of care' measure;
-
2.3 for the modernisation of hospital technology and digital equipment (digitisation);
-
1.8 for 'Community Homes and Taking Care of the Person';
-
1.4 billion for telemedicine;
-
1.2 to strengthen the technological infrastructure for data analysis;
-
other measures with amounts of less than one billion follow.
For the M7 - RepowerEU:
-
Transition 5.0, worth 6.3 billion, is the largest measure;
-
followed by 1.4 billion for the efficiency of public buildings;
-
1 billion to strengthen the railway fleet with zero-emission trains;
-
Other minor measures follow.
3.5 State of Play Considerations
The year 2024 has come to an end, but no up-to-date expenditure figures are yet available at the end of the period. Therefore, certain aspects must be borne in mind when assessing the progress of expenditure:
1) On the one hand, there is a mismatch between the data loaded into the system and the progress of the works. It is reasonable to expect a large increase in expenditure in the final two months of December:
-
due to a physiological delay in uploading data onto the platform by the Actuators;
-
because of 'progress report' (SAL) expenditure;
-
timing discrepancies arising from the fact that payments are made by the Implementing Entities to the project implementers, but the value of the expenditure incurred is validated later by the Lead Administrations once they receive the invoices from the Implementing Entities;
For example, last year, in October 2023, REGIS indicated a planned expenditure for the current year of only 3 billion, while it turned out ex-post to be almost 22 billion;
2) On the other hand, on the other hand, it is now likely that there will be actual delays in the grounding of some projects or that there will be less draught for some measures (the Centro Studi Confindustria forecast report assumes expenditures of about EUR 21 billion less in 2024 and EUR 19 billion less in 2025 than the financial planning available on REGIS). What is also worrying about the timely implementation of the Plan is that some of the resources spent in previous years concerned automatic or pre-existing measures.
Even assuming that all planned expenditure is realised in 2024, almost EUR 108 billion remains to be spent in 2025-2026. It is likely that by the end of 2026 not all the planned resources will be spent.
4. The international comparison
4.1 How is the PNRR timeline progressing?
Despite the possible spending delays highlighted in the previous section, it should be noted that the Plan is nevertheless advancing. The European Commission disburses financial resources in instalments only when the country has positively achieved the 'conditions' (Milestones & Targets) defined in the Plan for both reforms and investments, according to an agreed timetable. On this front, the PA seems to be performing well. To date, Italy has achieved the goals and targets set and, on 26 November, the European Commission approved a preliminary assessment on the positive achievement of the 39 targets related to the payment of the sixth instalment of 8.7 billion (Table B). The payment of the sixth instalment took place on 23 December, at the end of the usual procedural process, while the request for payment of the seventh instalment of 18.3 billion was submitted on 30 December.

4.2 Compared to other European countries, how is the Italian Plan progressing?
The pace of implementation of the Italian PNRR appears to be higher than that of other European countries (Chart 8). The Italian plan is the largest in terms of total resources: EUR 194.4 billion, followed by Spain (163), Poland (60) and France (42). This poses a considerable challenge because it increases the pressure on the administrative structure to ground projects.

However, for the time being, Italy ranks among the countries where the Plan is proceeding most rapidly, in relation to the agreements established with the European Commission:
-
43% of the targets and objectives were achieved, compared to the average 28% for countries whose plans are worth at least 5 billion;
-
64% of resources (122.1 billion, of which 46.5 billion as grants and 75.7 billion as loans) were disbursed to Italy by Europe, well above the European average (48%).
It should be borne in mind, however, that as the expiry of the NRP approaches, countries that have received a smaller amount of resources could quickly catch up with the Italian plan at this time.
APPENDIX


Related


Join the largest business community in Italy.
Highlighted topics
Our Platform